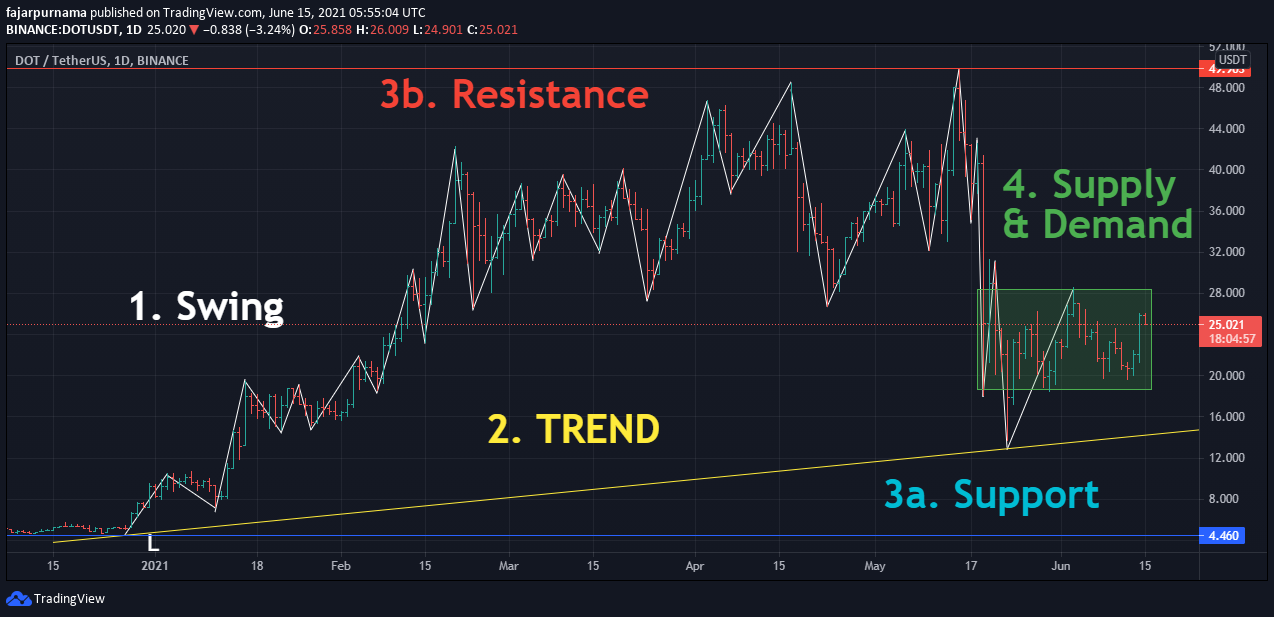
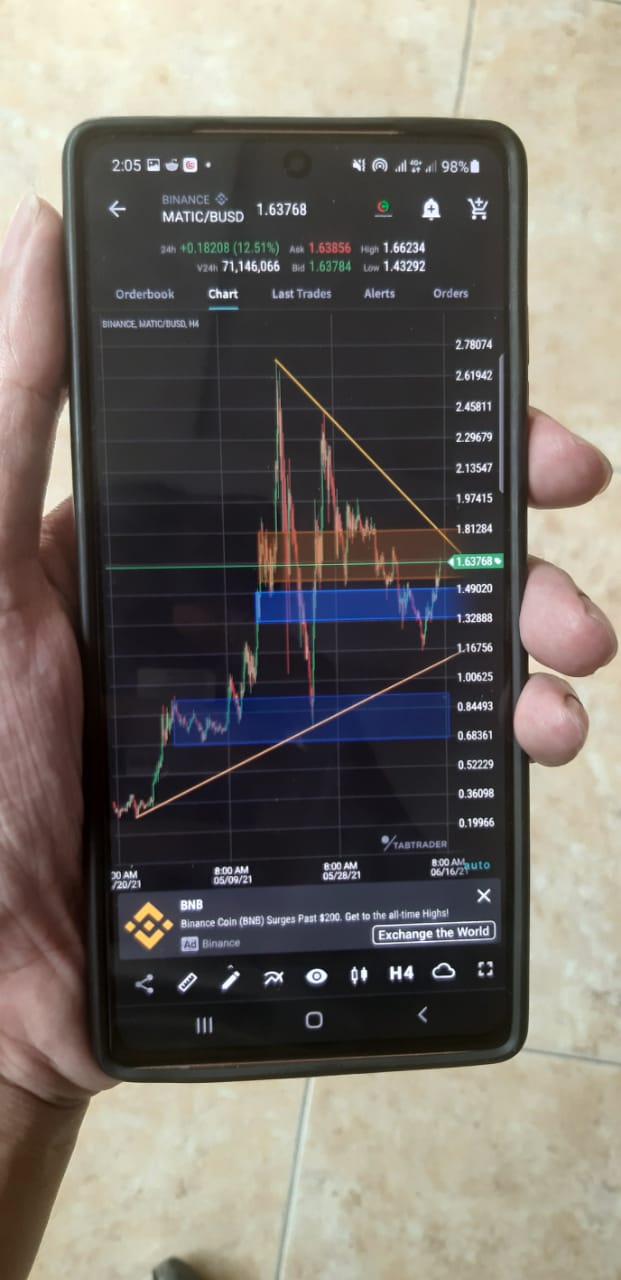
The previous chapter discussed about the DOW Theory where every financial technical analyzers have to remember when performing any analysis. This chapter discusses the basics of drawing lines on a chart. In many channels and social media we less often see traders not drawing lines but straight away using indicators and drawing chart patterns. The possibility is only two, either that they are already very experienced that they no longer need to draw basic lines where they imagine them in their minds like playing blind chess or they are neglecting the basics. If we often in loss by using chart patterns and indicators, probably our basics are not solid yet or worse we forget about the DOW theory. Therefore, it is recommended to build a solid foundation first on the basic where the basics or drawing lines are drawing swings, trends, supports & resistances, and supplies & demands.To start drawing, foreign exchanges, commodities, most stocks, and popular cryptocurrencies are available in Trading View for free. If you are into decentralized finance (DeFi) where most coins are not available in trading view, you can try Dex Tools for Ethereum ecosystem, and Dex Guru for Binance Smart Chain ecosystem. In smartphones, I use Tab Trader. Other than that, you can always install Metatrader but Leave a comment if you know more. For beginners, I suggest starting with bar charts before going to candle charts.
Swing
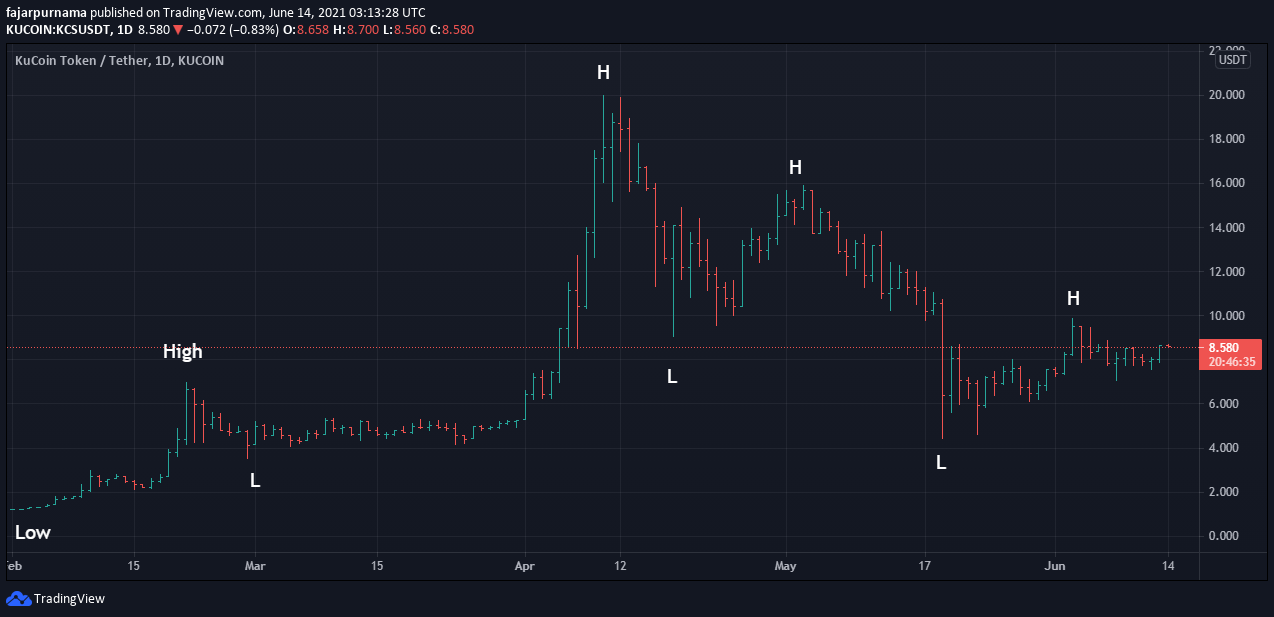
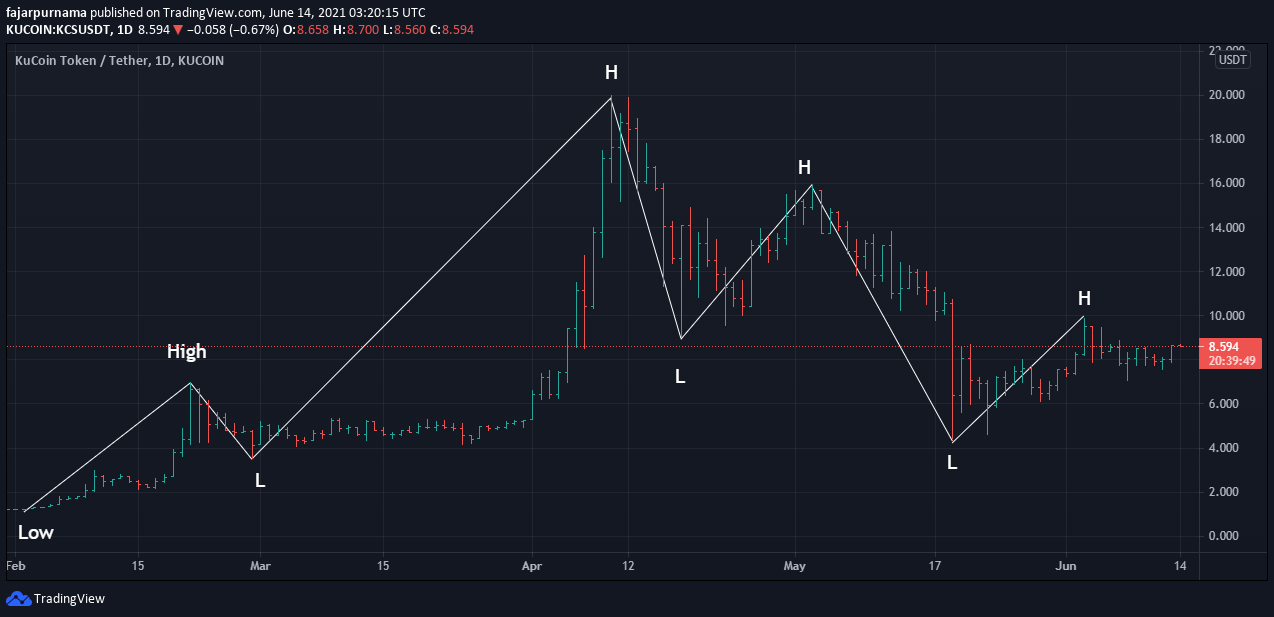
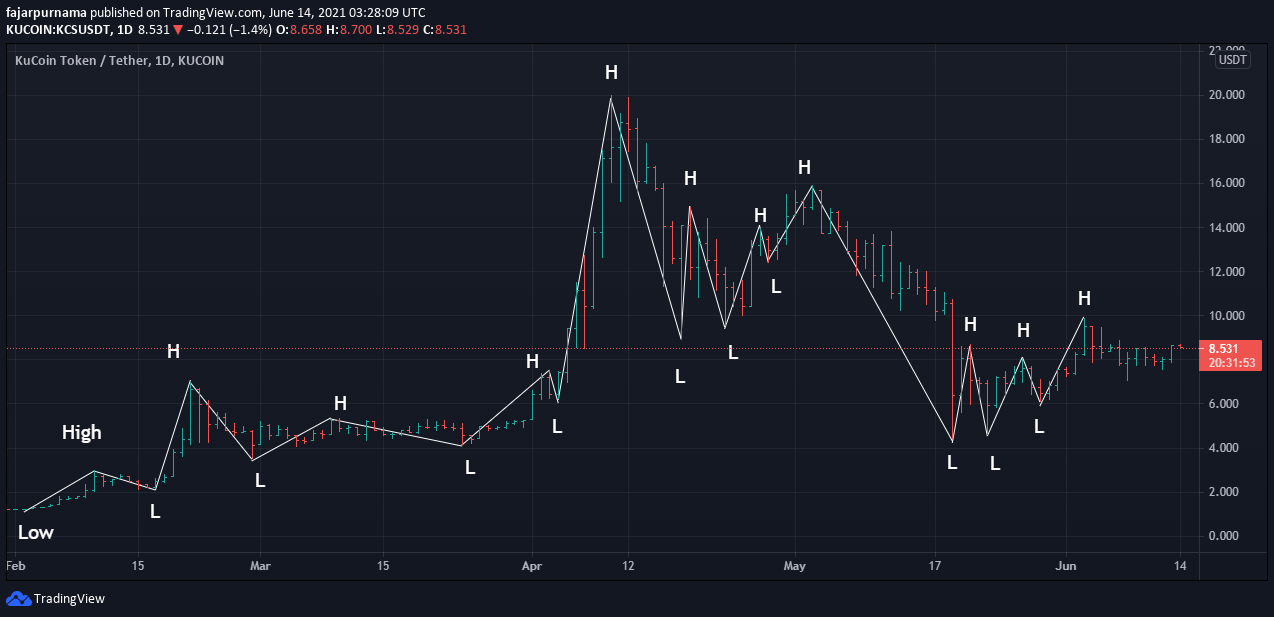
A swing literally is a swing. A Seat riding up and down is swing chair, mood going up and down is mood swing, and price going up and down is price swing. Thus in this chart is drawing the up down movements of a price action. While it is easy to show traders how to draw swings face to face but describing is a little difficult. The figure above should have been shown later but to describe swings with words must be done the opposite which is to be shown first. Thus to start drawing a swing from left to right is to determine a time frame, then a period like every 10 bars or 10 candles where we are free to choose, and finally find the lowest or highest price within that period. If the first chosen price is the lowest, then find the next highest price, and vice versa if the chosen price is the highest then find the next lowest price.Connect the labels with lines from left to right. The result a simpler view of the movement of the price, and the bottoms and the tops which will be used to make further drawings. During my financial technical analysis course, I was always taught when my drawings are wrong is because probably I did not draw the swings nicely. I searched Google, Investopedia, and Wikipedia, I could not find this theory. So this knowledge is obtained directly from my course.Wait, can't we draw a narrower swing? Sure we can. Back to the DOW Theory that there is no absolutely right nor wrong but there are most likely and less likely. We experiment with ourselves to see whether narrower or wider swings can make us analyze better or not. Although making wider swings compared to the previous wide swing figure are more prone to miscalculations than making narrower swings. I suggest making a swing on a longer time frame first such as above 4 hours timeline but make it shorter if there are no significant swings to be found.
Trend
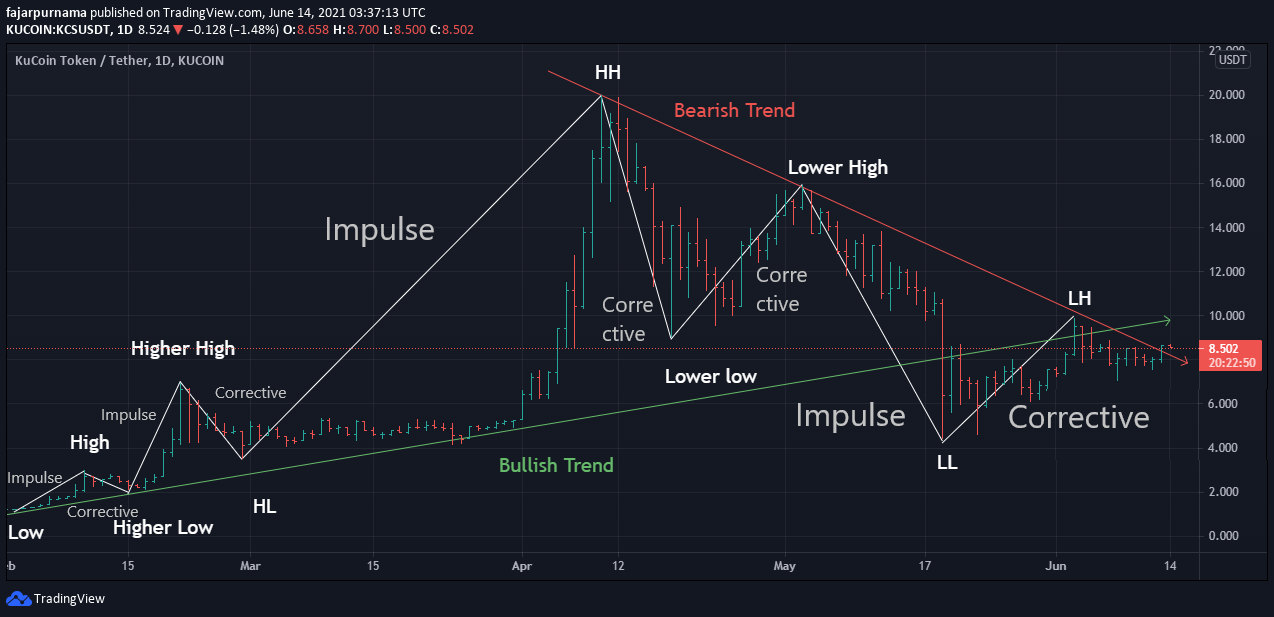
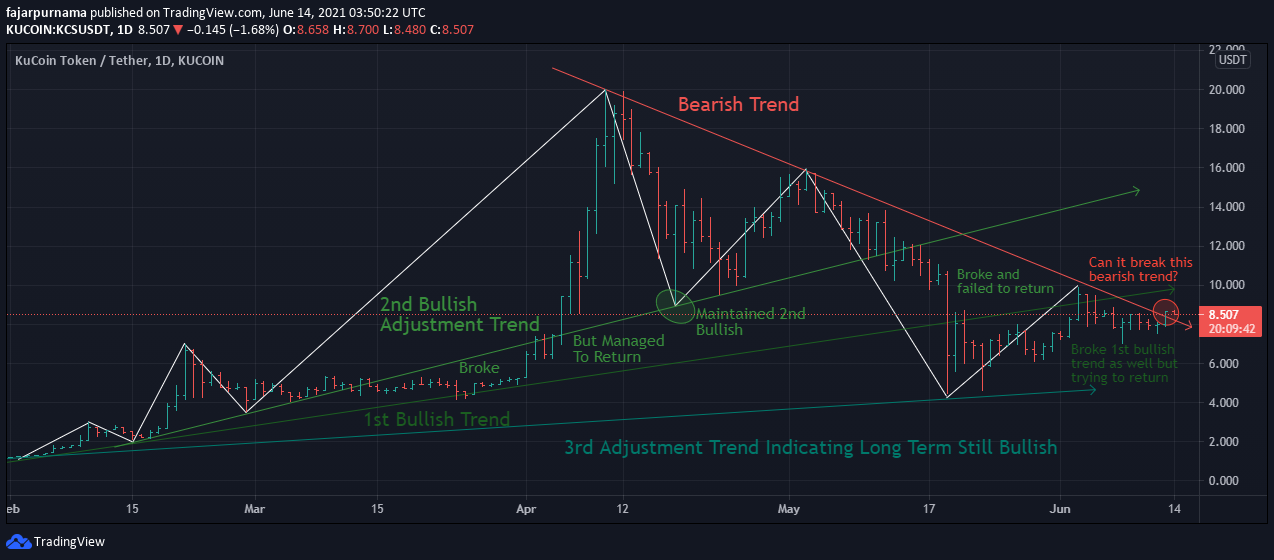
The DOW Theory stated that there are three trends which are bullish, bearish, and sideways, although sideways are rarely drawn. Again, it is easy to show how to draw a trend face to face but to describe it with words, we must first change the labels after the first twos to either lower lows, lower highs, higher lows, or higher highs. When there are more higher lows and higher highs then the trend seems bullish and the opposite if there are more lower lows and lower highs then the trend seems bearish. In a bullish trend, the upward movement is usually longer then the downward movement and vice versa in a bearish trend where the downward movement is usually longer then the upward movement. The longer movement is called impulsive, and the shorter movement is called corrective.Wait, can't we just draw the trend like this? Sure we can. To draw a trend, connect the low with a higher low where the next periods have a higher high for a bullish trend or connect the high with a lower high where the next periods have a lower low for bearish trend. Trend often breaks and when the price failed to return to the trend, then the trend officially broke where we have to draw an adjustment trend.
Cryptocurrency believers and supporters often Dollar Cost Average (DCA) or buy small amounts every certain periods like an installment. It is a good idea to do this whenever the price touches the trend line. Not only it is much better than buying at the top but buying whenever the price touches the trend line helps maintains the bullish trend which should be inline with the goal of believers and supporters. If a clear trend break occurs, it is better to wait and DCA in the next lower bullish trend line.
Support and Resistance
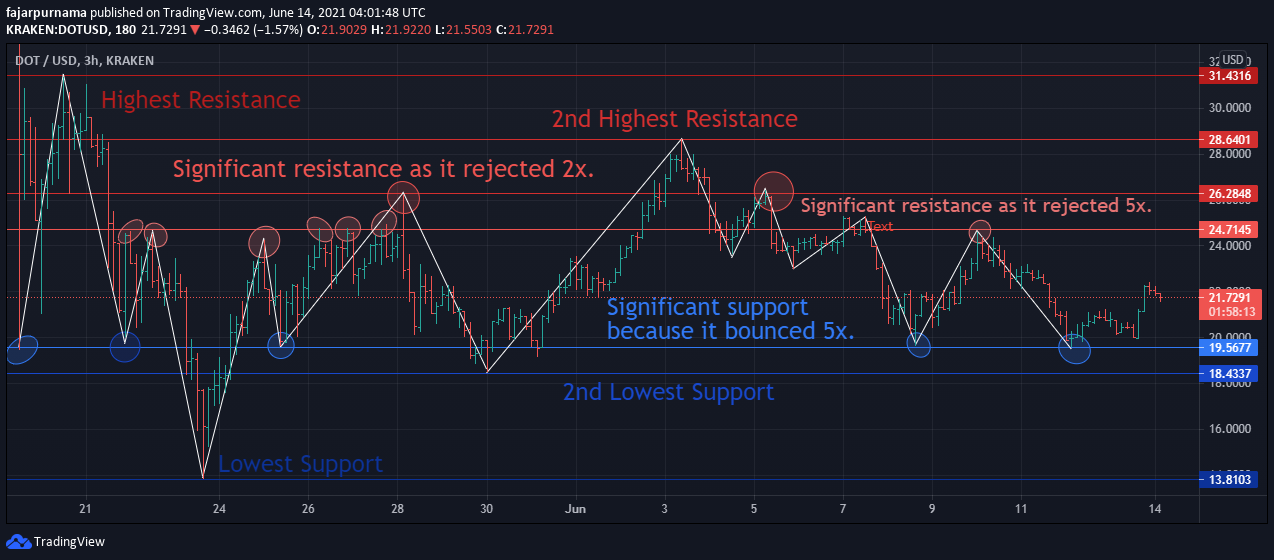
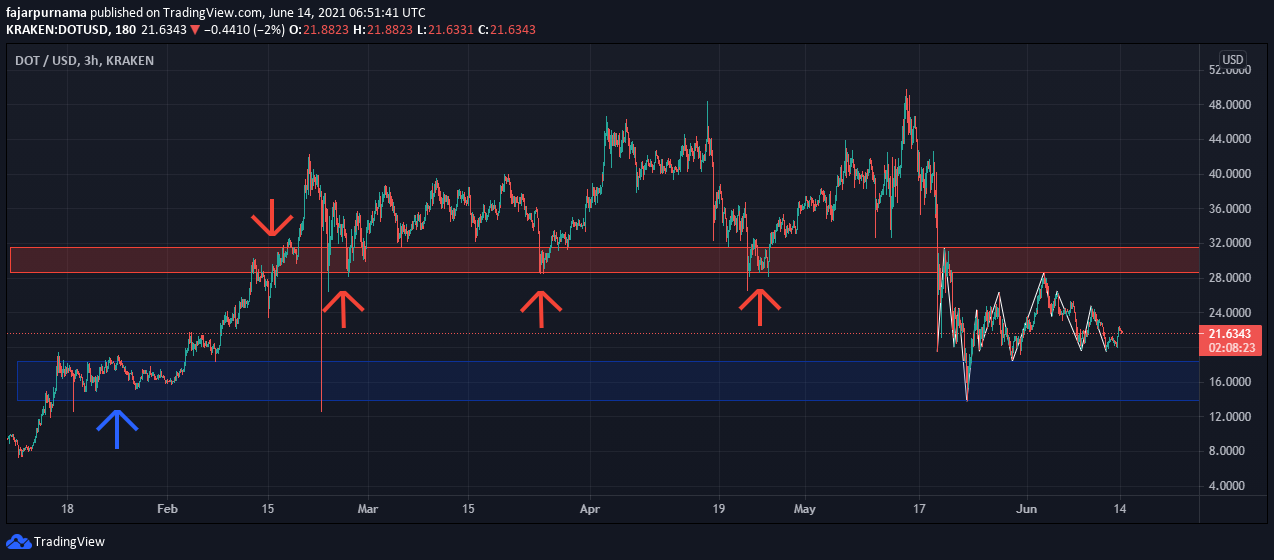
Support is literally support to keep the price from falling where in the chart it is seen as a price bounce like the bottom of a well. Resistance is also literally resistance to keep the price from flying where in the chart it is seen as a price rejection like the top of a mountain. It is simply most likely a buy signal when the price nears the support line and a sell signal when the price nears the resistance line.
The first support line to draw is the lowest price action in the current visible chart and vice versa for the first resistance line which is the highest price action. For me, I like to draw another support line at the second lowest sharp downward spike and vice versa for another resistance line the second highest mountain. Last is to draw significant support and resistance lines. The more often the price bounces the more significant the support line and the more often the price rejects the more significant the resistance line.
For cryptocurrency believers and supporters, the next line to DCA is the support line when the trend breaks. For traders is a chance to buy big because the price oftens bounce big for a short time which is a chance to win short term profit. If going big, make sure to stop loss when the price breaks down the support line because there will be high probability that the price will continue to drop. For beginners, the resistance line is not a good place to hurry and buy. It is best to analyze first whether it can break the resistance line or not. If not, wait for some bullish news and breaks to be safe.
Supply and Demand
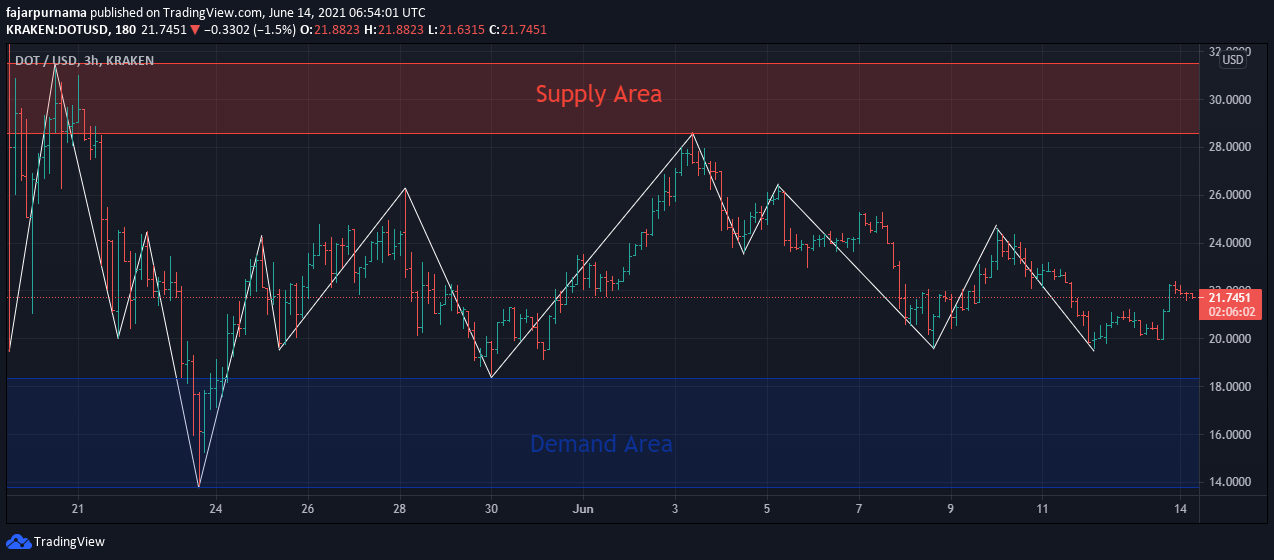
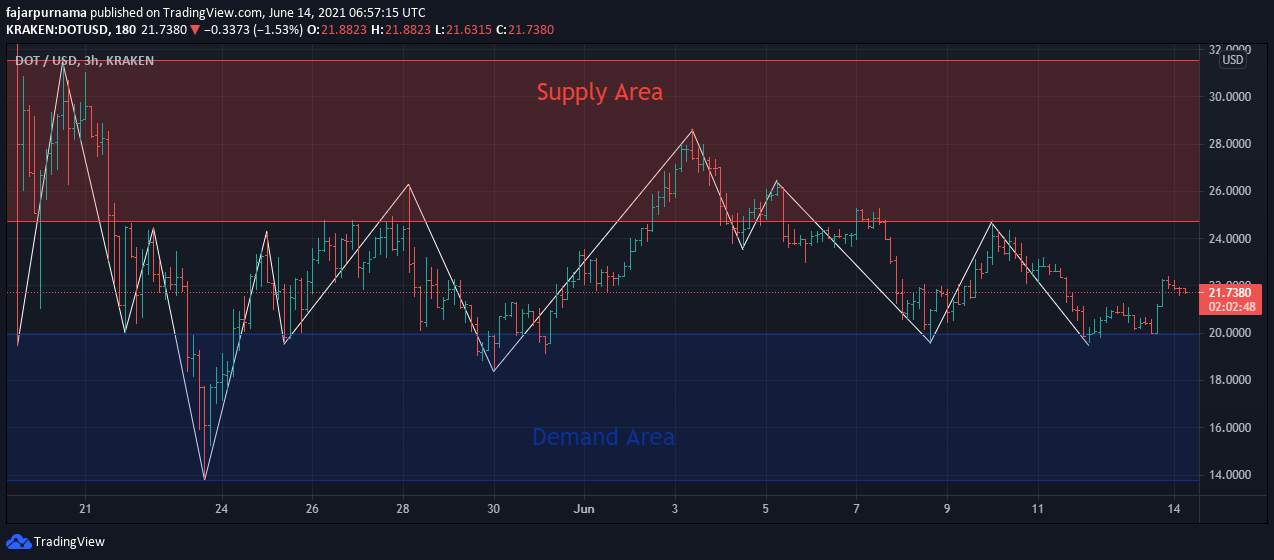
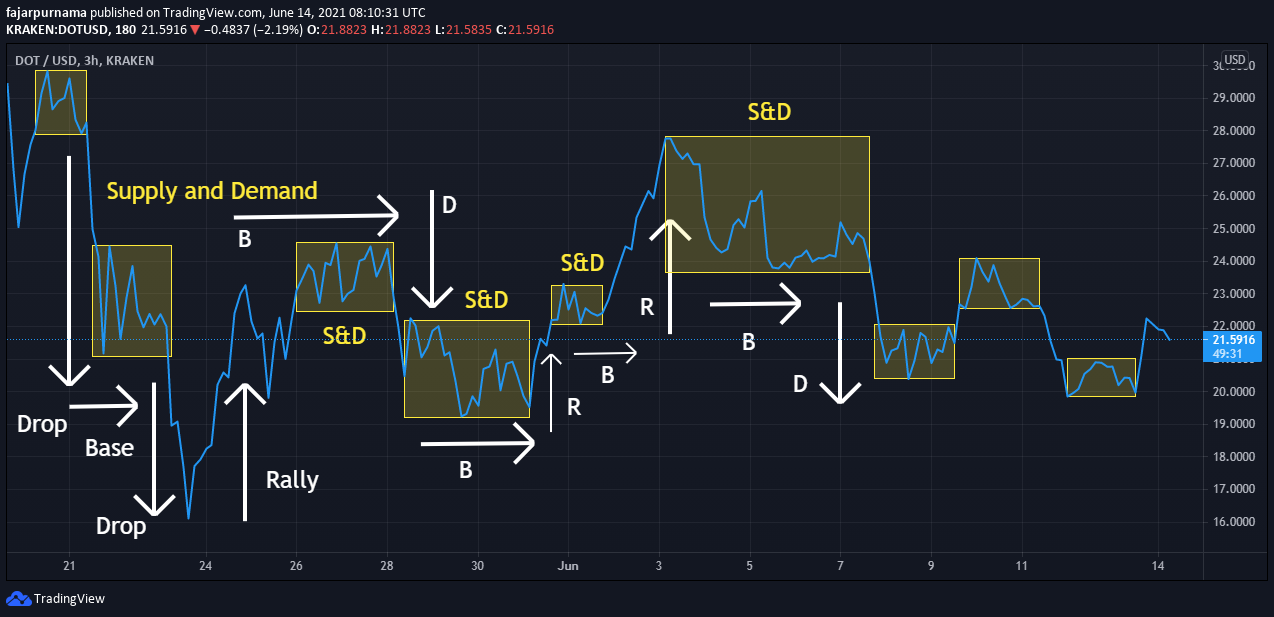
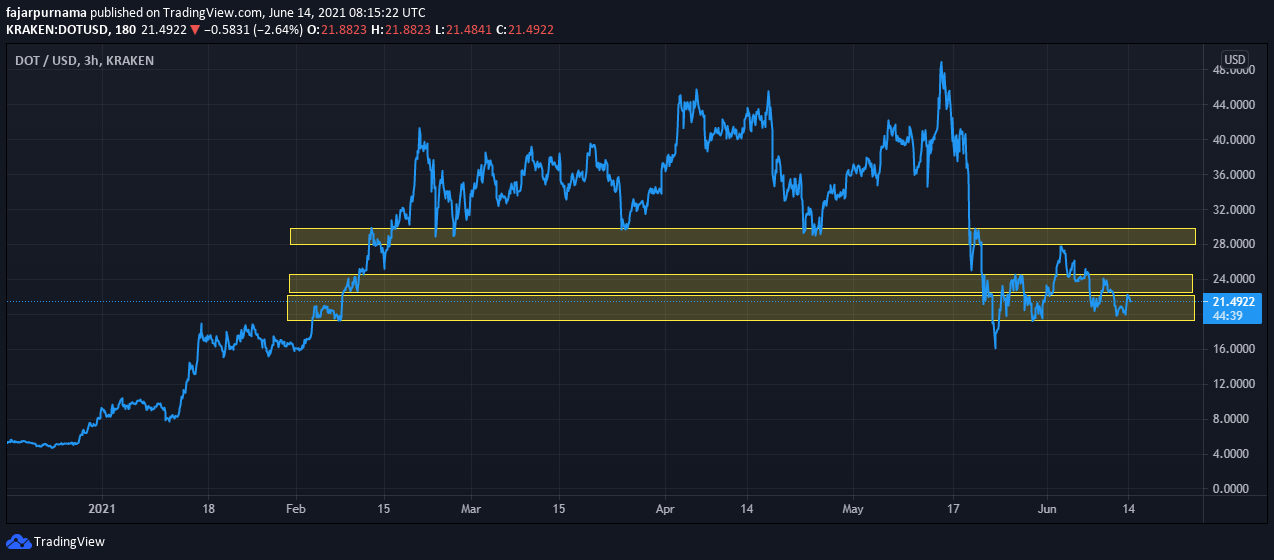
While supports and resistances are horizontal lines, supplies and demands are horizontal area. Buying at the support line and selling at the resistance line is a great deal but how long must we wait until the price touches the support or resistance line? Even when we reached a point that the price touches the support and resistance line, we may just miss it due to busy with life. Often, the price does not touch the lines at all but bounced somewhere near it. Therefore, drawing supplies and demands area are helpful.The basic way to find a supply area is to draw a rectangle between the peak of the highest mountain and the peak of the second highest mountain. The vice versa for the demand area which is to draw a rectangle between the bottom of the lowest well and the bottom of the second lowest well. After dragging the rectangles to the right a bit, drag them far to the left where the more price action the rectangle touches, the more significant they are.Can't we enlarge the triangle not only highlighting up to second highest mountain or second lowest well but up to the third one? That is fine as well where suite ourselves which one gives us more accurate analysis. A supply is an area of frequent selling and demand is an area of frequent buying. As long the rectangles meets this criteria, it is still correct. When the price is in the supply area, we should be aware of rejections or aware of breaking the roof. When the price is in the demand area, we should be aware of bounces or aware of breaking the ground.Another type of supply and demand area is an area where the price action often stays. In the DOW Theory of 3 phases, it is either an accumulation area or distribution area. In terms of signals in electromagnetic wave looks like a noise. There are four occurrence of a supply and demand area. The first one occurs after a significant increase in price then ended with another significant increase in price (rally-base-rally). The second one occurs after a significant increase in price then ended with a significant decrease in price (rally-base-drop). The third one occurs after a significant decrease in price then ended with another significant decrease in price (drop-base-drop). The fourth one occurs after a significant decrease in price then ended with a significant increase in price (drop-base-rally). I find it easier to use line chart to find this kind of supply and demand area.As always, drag the rectangles to the right and to the left to see which ones are significant. Based on my experience, both support and resistance line and supply and demand area deserves my attention as either a reversal or a breakthrough may come soon. The difference is while support and resistance area requires my immediate attention, supply and demand area only requires my caution. Finally, the supply and demand area is useful to predict which area a price action will visit after breaking a support or resistance line. Crypto believers and supporters should refrain from DCA after a price clearly breaks a support line until it reaches the next supply and demand area below.
Reminder
After learning swings, trends, support & resistance, and supply & demand, most of us are probably eager to try trading straight away but do not forget that if we trade based on this alone, we are only using technical analysis which there more factors to consider. One of the DOW Theory tells us to always confirm the market where when we finish drawing technical analysis, do not forget to confirm with the news etc. Also, another DOW Theory to not forget to look at the bigger picture first. Once again, this method can be applied anywhere such as commodities, stocks, and foreign exchanges. For crypto supporters, why do we need need this method if we can just buy at every dip or dollar cost average (DCA) every month? This method can improve our buying timing where we can accumulate more crypto than just randomly buying.
Recording success in Cryptocurrency, Bitcoin is not just buying and holding till when bitcoin sky-rocks, this has been longed abolished by intelligent traders ,mostly now that bitcoin bull is still controlling the market after successfully defended the $40,000 support level once again ad this is likely to trigger a possible move towards $50,000 resistance area However , it's is best advice you find a working strategy by hub/daily signals that works well in other to accumulate and grow a very strong portfolio ahead. I have been trading with Mr Carlos daily signals and strategy, on his platform, and his guidance makes trading less stressful and more profit despite the recent fluctuations. I was able to easily increase my portfolio in just 3weeks of trading with his daily signals, growing my 0.9 BTC to 2.9BTC. Mr Carlos daily signals are very accurate and yields a great positive return on investment. I really enjoy trading with him and I'm still trading with him, He is available to give assistance to anyone who love crypto trading and beginners in bitcoin investment , I would suggest you contact him on WhatsApp: +1(424)285-0682 and telegram : @IEBINARYFX for inquires and profitable trading platform systems. Bitcoin is taking over the world.
Recording success in Cryptocurrency, Bitcoin is not just buying and holding till when bitcoin sky-rocks, this has been longed abolished by intelligent traders ,mostly now that bitcoin bull is still controlling the market after successfully defended the $40,000 support level once again ad this is likely to trigger a possible move towards $50,000 resistance area However , it's is best advice you find a working strategy by hub/daily signals that works well in other to accumulate and grow a very strong portfolio ahead. I have been trading with Mr Carlos daily signals and strategy, on his platform, and his guidance makes trading less stressful and more profit despite the recent fluctuations. I was able to easily increase my portfolio in just 3weeks of trading with his daily signals, growing my 0.9 BTC to 2.9BTC. Mr Carlos daily signals are very accurate and yields a great positive return on investment. I really enjoy trading with him and I'm still trading with him, He is available to give assistance to anyone who love crypto trading and beginners in bitcoin investment , I would suggest you contact him on WhatsApp: +1(424)285-0682 and telegram : @IEBINARYFX for inquires and profitable trading platform systems. Bitcoin is taking over the world.
ReplyDelete