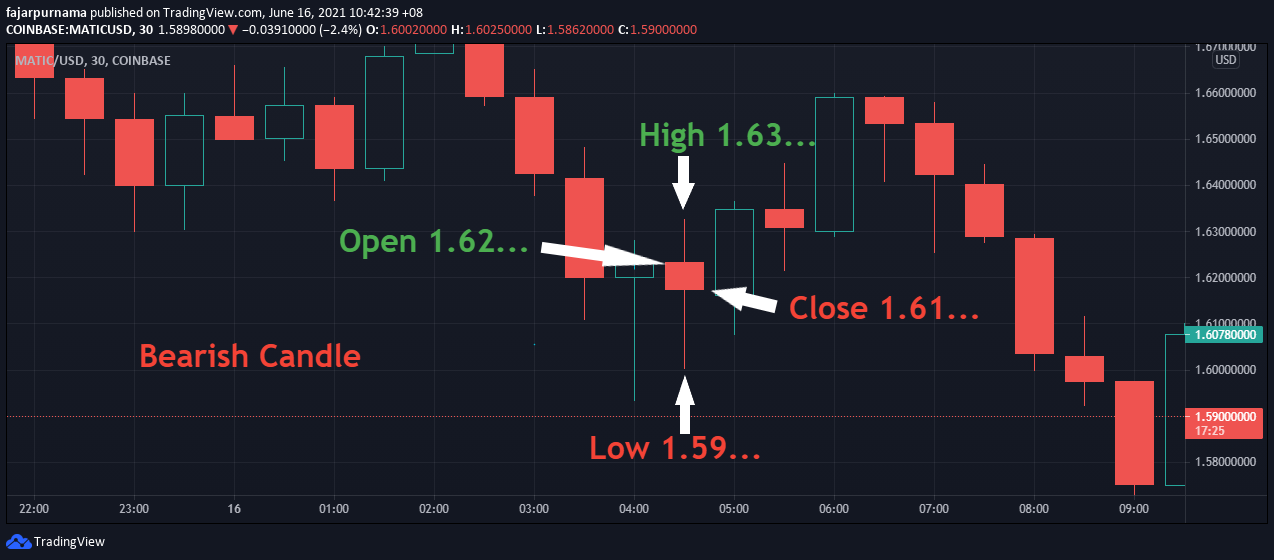
Simplest Pattern
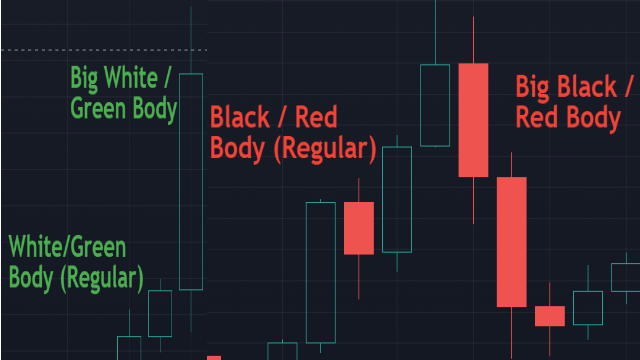
Candle Body Length
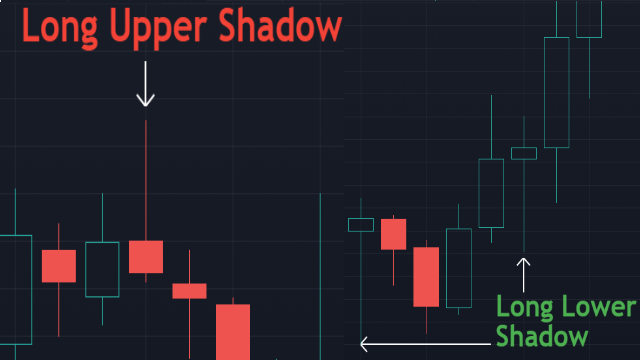
Candle Shadow Length
Simple Patterns
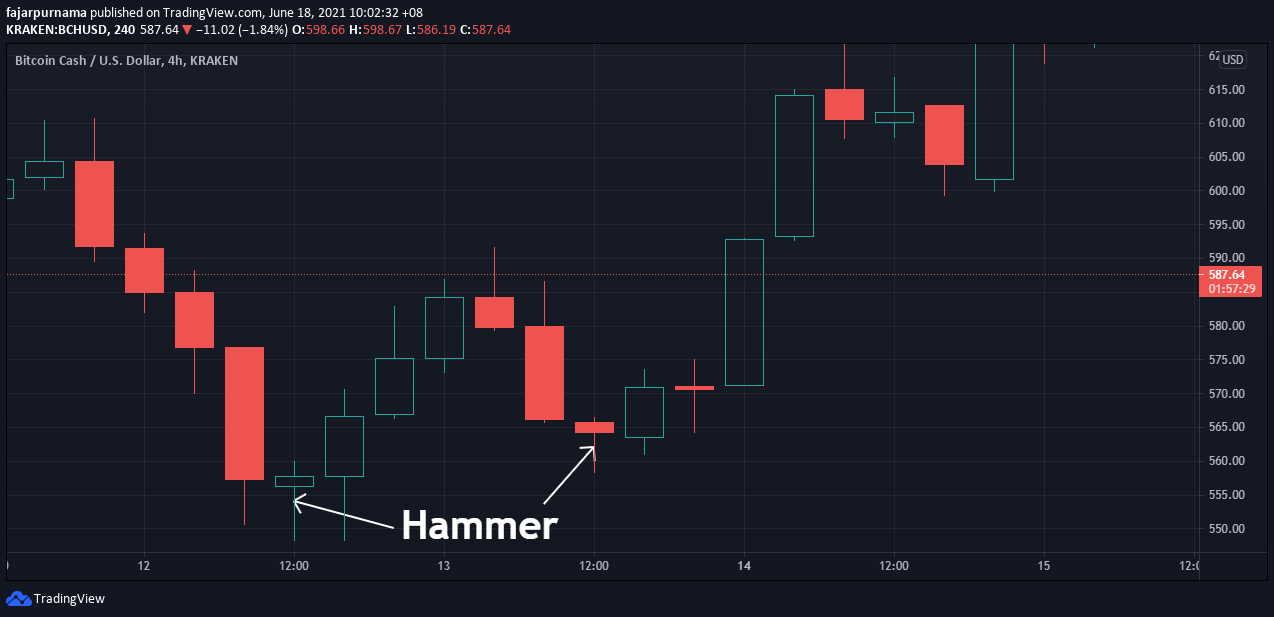
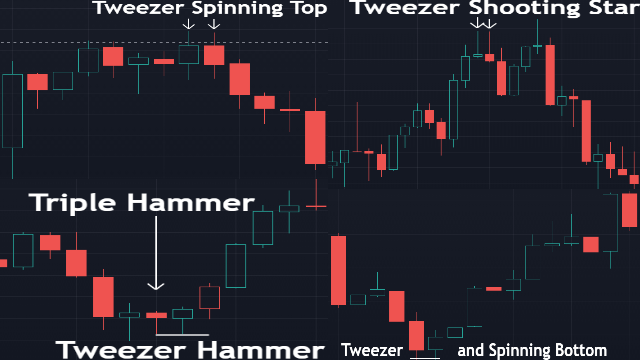
Hammer
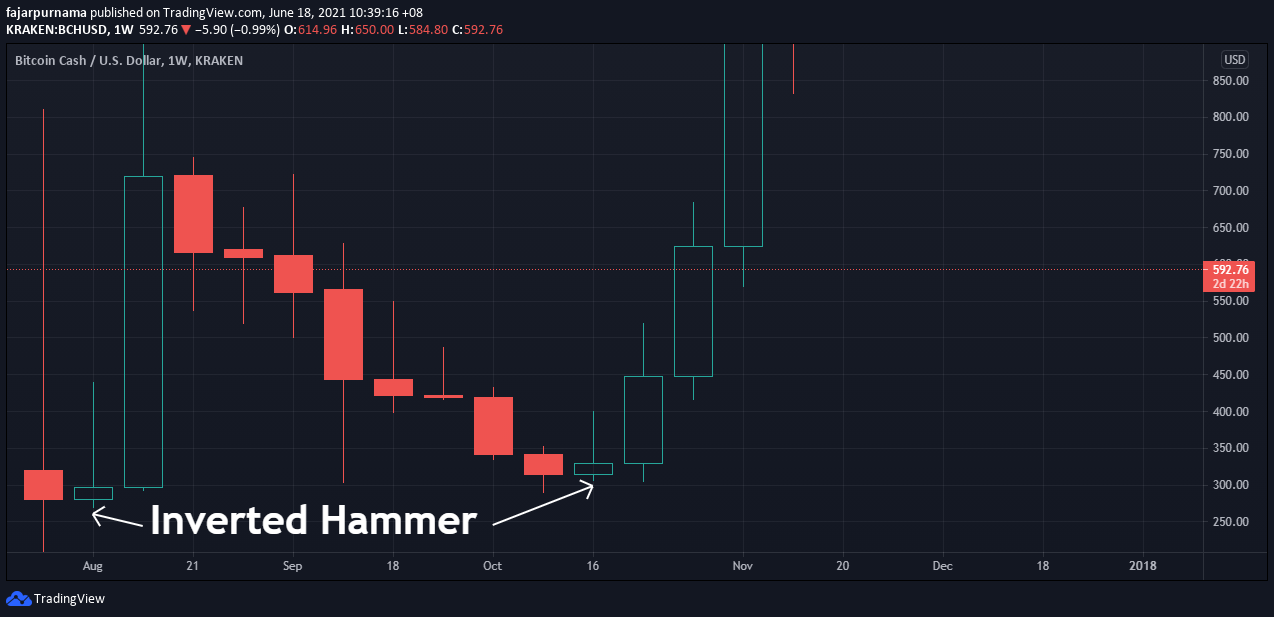
Inverted Hammer
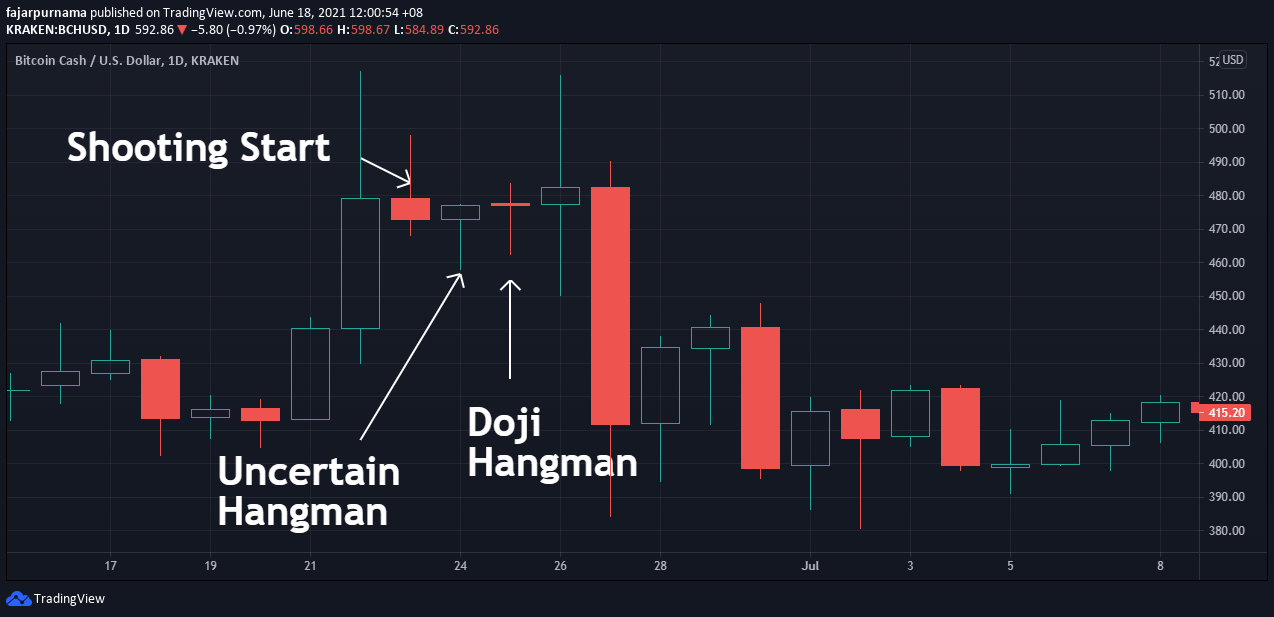
Hanging Man
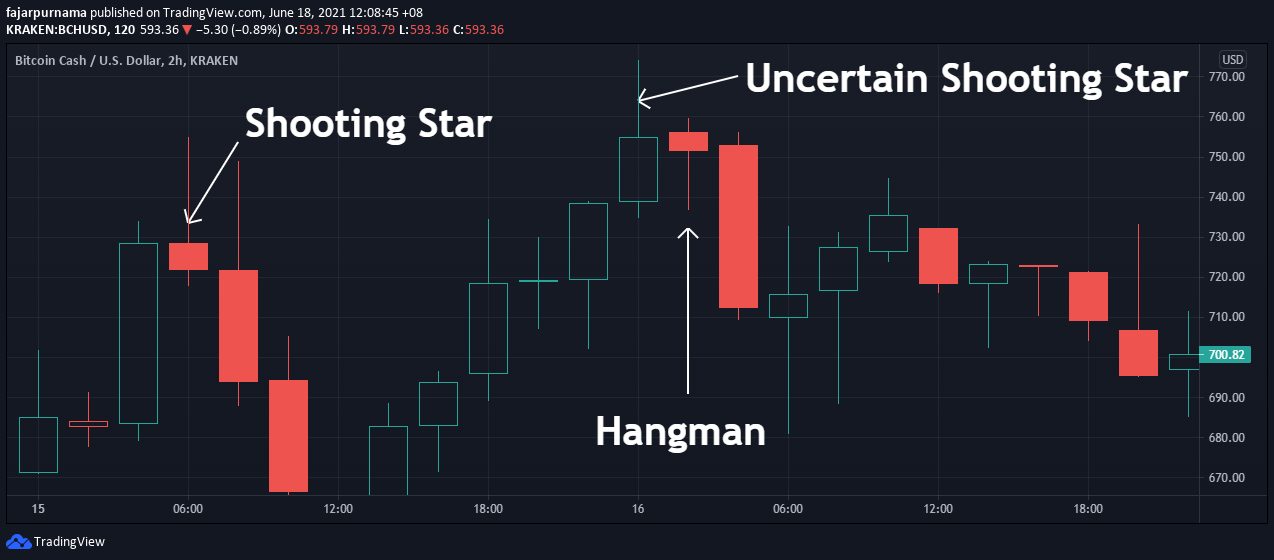
Shooting Star
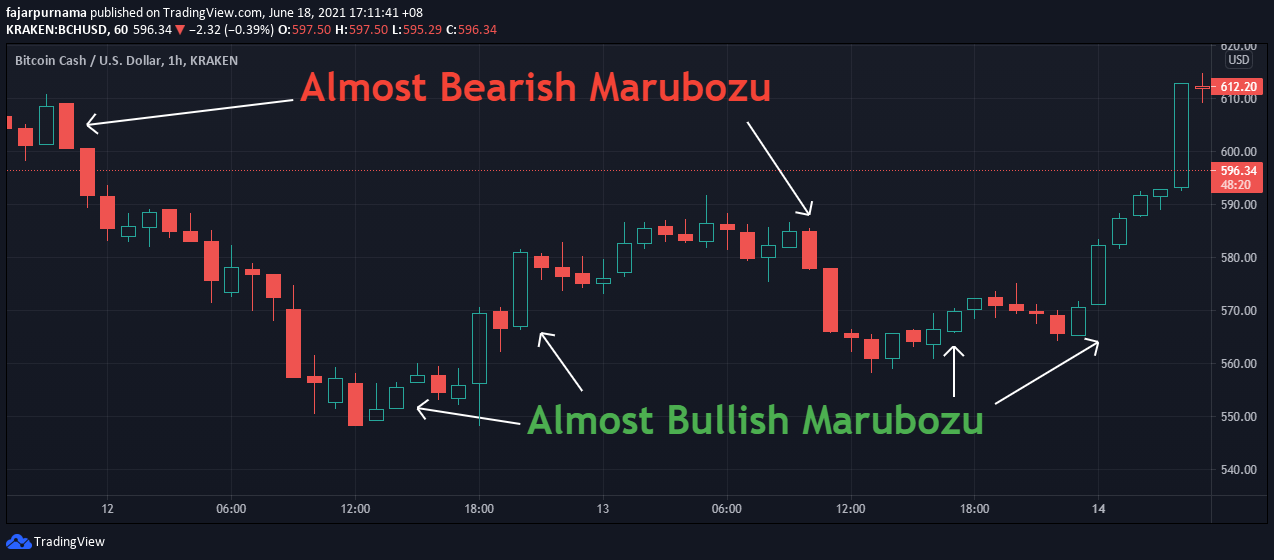
Marubozu
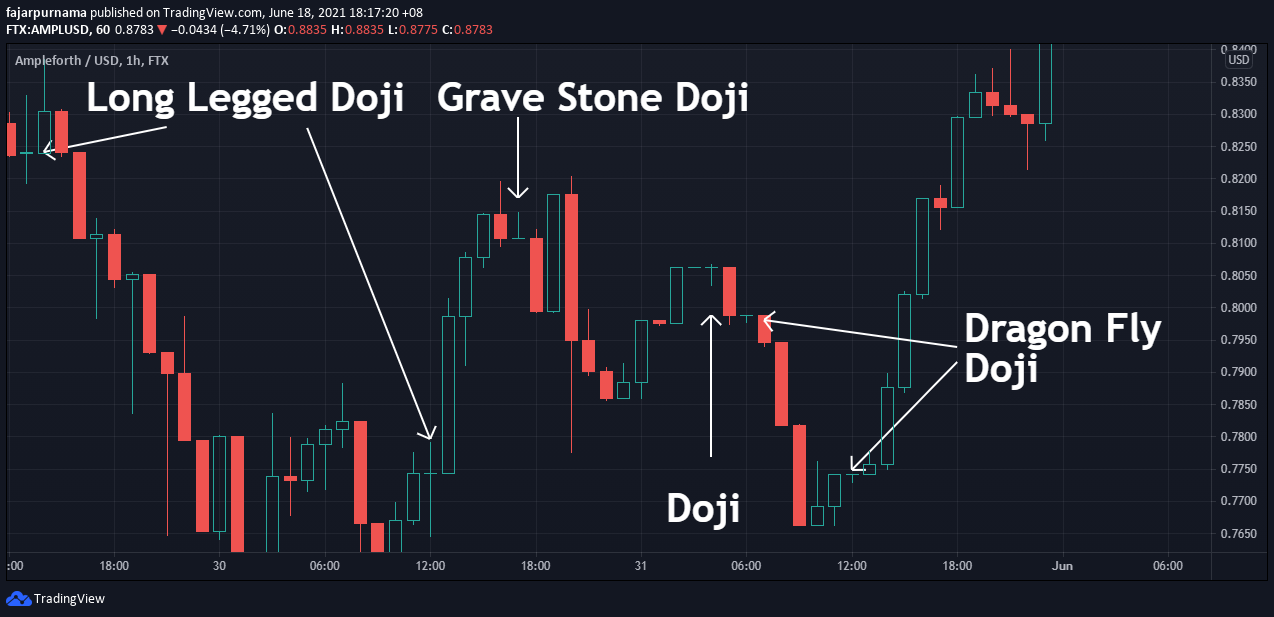
Doji
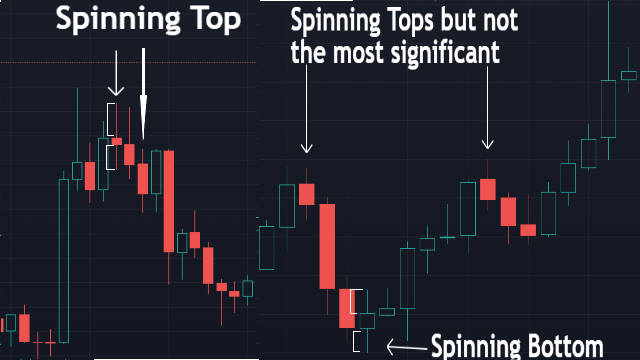
Spinning Top and Spinning Bottom
Popular Complex Patterns
Tweezer
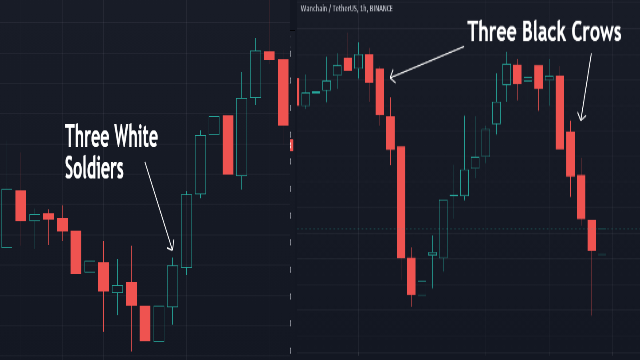
3 White Soldiers and 3 Black Crows
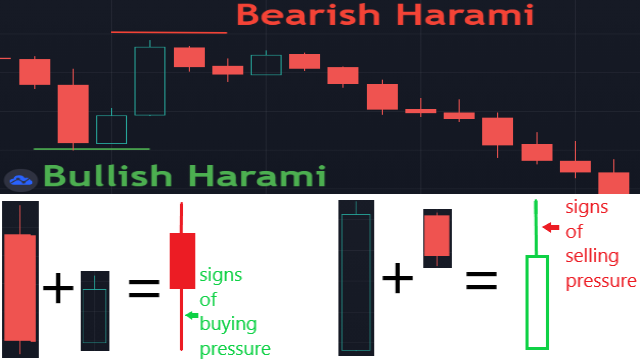
Harami
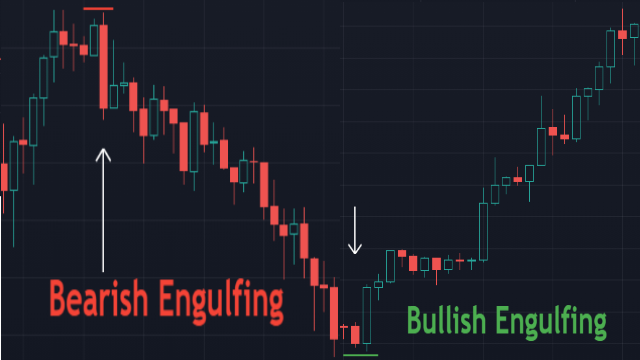
Engulfing
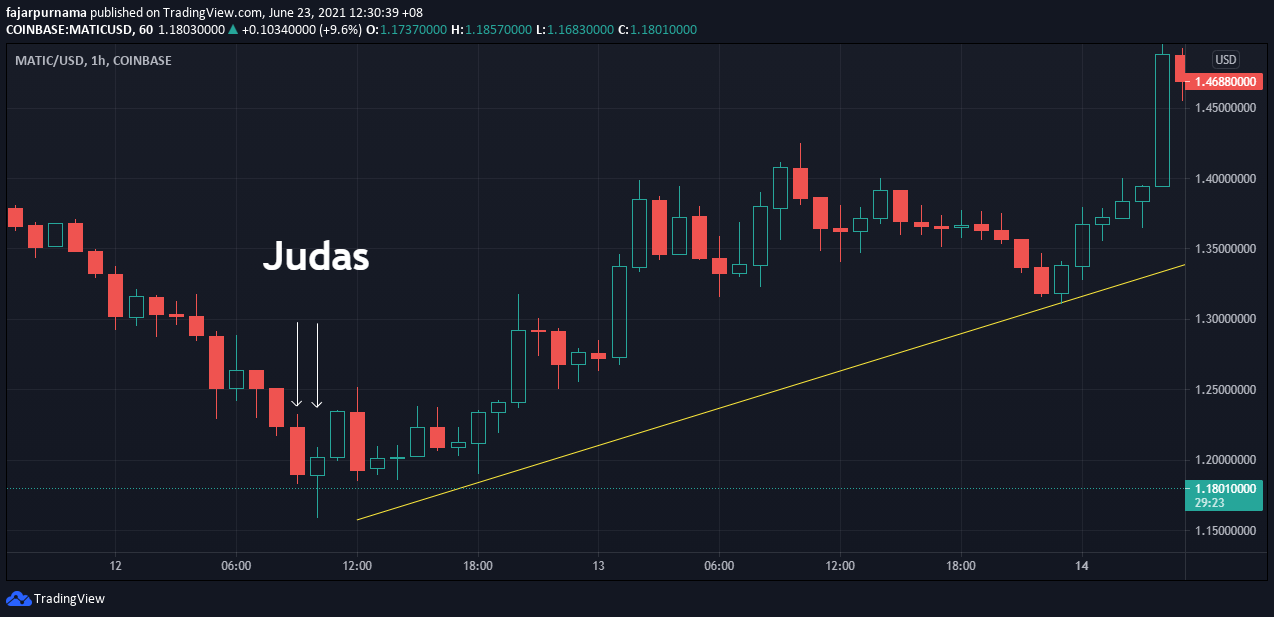
Judas
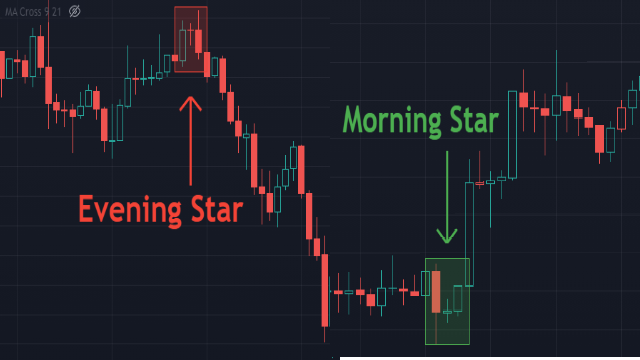
Stars
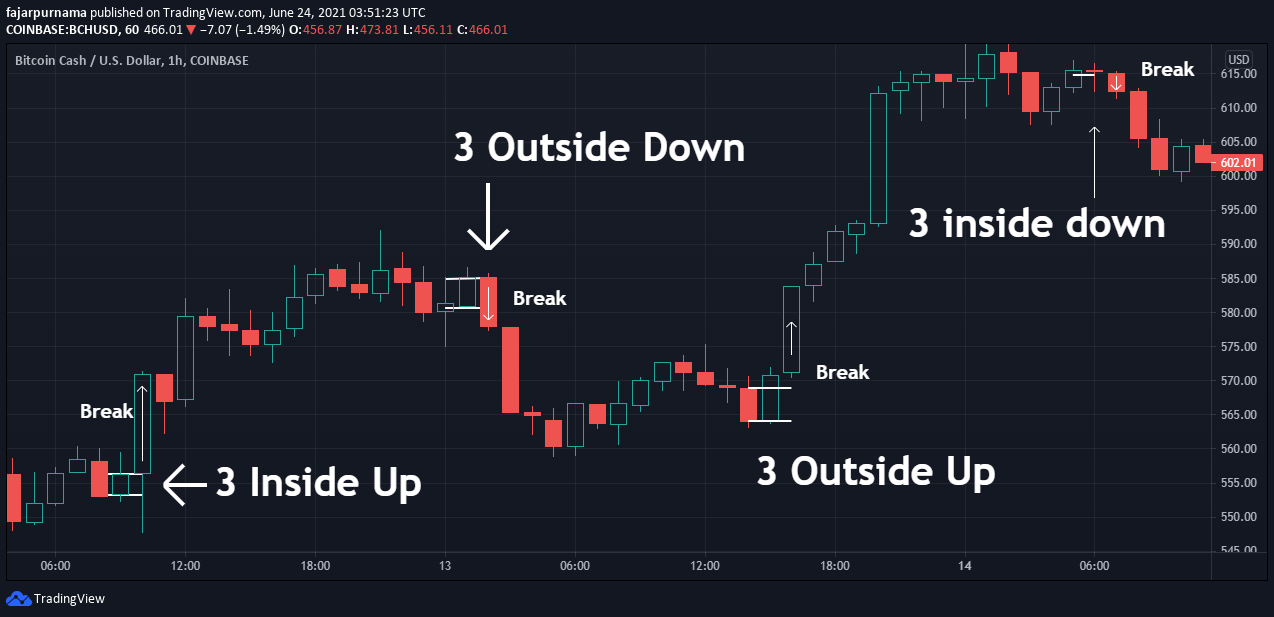
3 Inside and 3 Outside
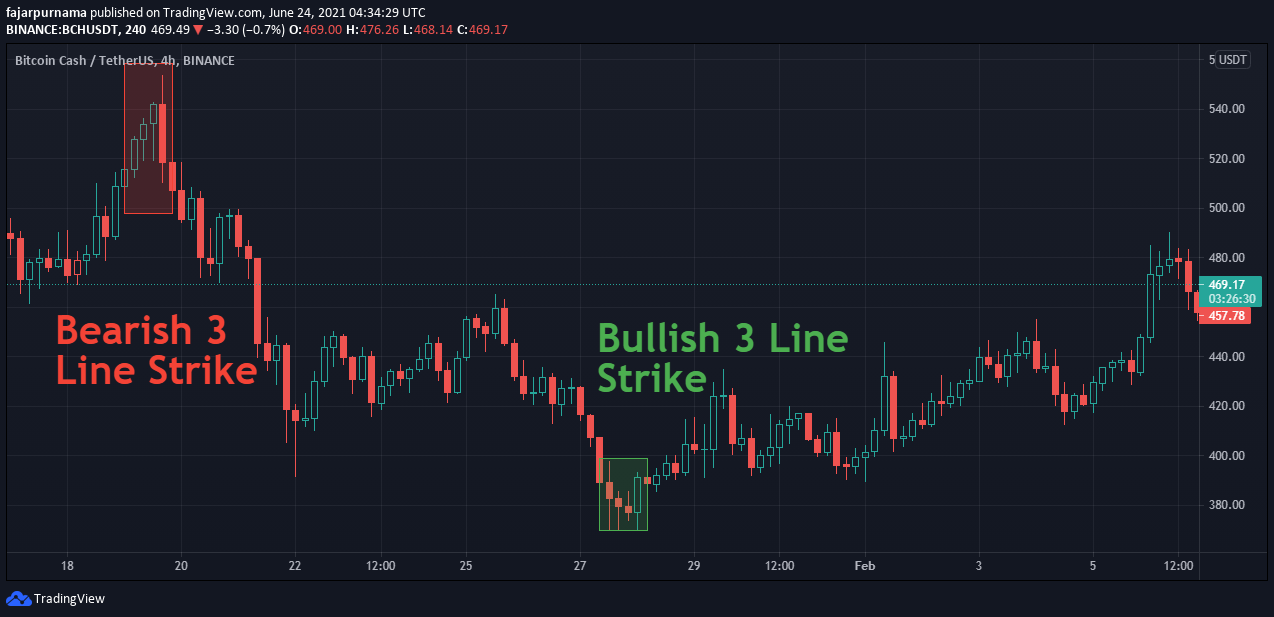
3 Line Strike
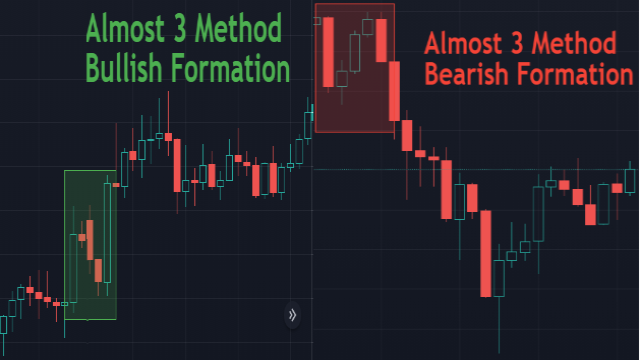
3 Method Formation
Wait
Mirrors
- https://www.publish0x.com/cryptocurrency-101-for-users/financial-technical-analysis-crypto-narrative-chapter-3-cand-xqmoqve?a=4oeEw0Yb0B&tid=blogger
- https://0darkking0.blogspot.com/2021/06/financial-technical-analysis-crypto_24.html
- https://0fajarpurnama0.medium.com/financial-technical-analysis-crypto-narrative-chapter-3-candle-stick-patterns-7862e4a61173
- https://0fajarpurnama0.github.io/cryptocurrency/2021/06/03/fta-crypto-chapter-3
- https://hicc.cs.kumamoto-u.ac.jp/~fajar/cryptocurrency/fta-crypto-chapter-3
- https://steemit.com/cryptocurrency/@fajar.purnama/financial-technical-analysis-crypto-narrative-chapter-3-candle-stick-patterns?r=fajar.purnama
- https://leofinance.io/@fajar.purnama/financial-technical-analysis-crypto-narrative-chapter-3-candle-stick-patterns?ref=fajar.purnama
- https://blurtter.com/cryptocurrency/@fajar.purnama/financial-technical-analysis-crypto-narrative-chapter-3-candle-stick-patterns?referral=fajar.purnama
- https://0fajarpurnama0.wixsite.com/0fajarpurnama0/post/financial-technical-analysis-crypto-narrative-chapter-3-candle-stick-patterns
- http://0fajarpurnama0.weebly.com/blog/financial-technical-analysis-crypto-narrative-chapter-3-candle-stick-patterns
- https://0fajarpurnama0.cloudaccess.host/index.php/8-cryptocurrency/cryptocurrency-101-for-users/233-financial-technical-analysis-crypto-narrative-chapter-3-candle-stick-patterns
- https://read.cash/@FajarPurnama/financial-technical-analysis-crypto-narrative-chapter-3-candle-stick-patterns-12d910d4
- https://trybe.one/financial-technical-analysis-crypto-narrative-chapter-3-candle-stick-patterns
- https://www.floyx.com/article/0fajarpurnama0/financial-technical-analysis-crypto-narrative-chap-000107c781
- https://markethive.com/0fajarpurnama0/blog/financialtechnicalanalysiscryptonarrativechapter3candlestickpatterns
Comments
Post a Comment