Note
This is my English translated assignment from my undergraduate Telecommunication System Reliability course regarding the Nagios application which can monitor the state of computer networks. Coincidently at that time I was also an assistant at computer laboratory and I got the opportunity to apply Nagios in the lab. This task has never been published anywhere and I, as the author and copyright holder, license this task as customized CC-BY-SA where anyone can share, copy, republish, and sell it provided that to mention my name as the original author and notify that the original and open version available here.
Chapter 1 Introduction
1.1 Background
Nagios a server application to monitor network conditions. In general, what is monitored is the hosts' services such as check_ping, check_uptime, check_mrtgtraf and other services. The advantage of Nagios is that monitoring can be viewed via a web page (via port 80 http). So that administrators can monitor remotely. Initially the author had never used Nagios to monitor. The author wishes to know the quality of Nagios according to the author's personal view. For monitoring materials, 10 computers and 1 switch are provided in the computer laboratory, Electrical Engineering, Udayana University. In this experiment we will try to use Nagios to monitor 10 computers and 1 switch in Labkom, besides that, also monitor yourself (localhost) and 1 linux server via the Internet network, namely https://elearning.unud.ac.id
1.2 Problem
What is the quality according to personal view of using Nagios to monitor computers and switches in the computer lab, Electrical Engineering, Udayana University?
1.3 Objective
Knowing how to use Nagios in the computer lab, Electrical Engineering, Udayana University.
1.4 Benefit
- Give feedback on how to build Nagios in computer lab.
- The use of Nagios can be applied elsewhere.
1.5 Scope and Limitation
- Monitor RTA (Round Trip Average), and several services in the application layer in the OSI model.
- The material being monitored is the host of Windows, Linux, and Cisco switches.
Chapter 2 Literature Review
2.1 Nagios
Nagios is a powerful monitoring system that allows organizations to identify and resolve IT infrastructure problems before they affect critical business processes. First launched in 1999, Nagios has grown to include thousands of projects developed by the Nagios community around the world. Nagios is officially sponsored by Nagios Enterprises, which supports the community in a number of different ways through the sale of commercial products and services. Nagios monitors the entire IT infrastructure to ensure systems, applications, services and business processes are functioning properly. In the event of a failure, Nagios can alert technical staff of problems, allowing them to initiate the remediation process before it affects the business process, end users, or customers (Nagios, 2013).
2.2 Ping
Ping is the name of a standard software utility (tool) used to test network connections. It can be used to determine whether a remote device (such as a Web or game server) is reachable over the network and, if so, the latency of this connection. The Ping tool is part of Windows, Mac OS X and Linux as well as some routers and game consoles. Most ping tools use the Internet Control Message Protocol (ICMP). They send request messages to the target network address at regular intervals and measure the time it takes for response messages to arrive. These tools usually support options such as, how many times to send a request, how big a request message to send, how long to wait for each response. The output of the ping varies depending on the device. Standard results include, the IP address of the responding computer, the time period (in milliseconds) between sending the request and receiving the response, an indication of how many network hops between requesting and responding to the computer, error messages if the target computer does not respond (Mitchell, 2013).
Chapter 3 Methods and Materials
3.1 Place and Time
Experiments were carried out at the Computer Lab, Electrical Engineering, Udayana University on April 13, 2013 to April 19, 2013.
3.2 Tools
| NO | Tools | Specification |
|---|---|---|
| 1 | Laptop ACER | Intel® Pentium® dual-core processor T4200 (2.0 GHz, 800 MHz FSB, 1 MB L2 cache) Mobile Intel® Graphics Media Accelerator 4500MHD 1GB DDR2 128 WXGA Acer CrystalBriteTM LCD 250GB HDD Realtek Semiconductor Co., Ltd. RTL8111/8168B PCI Express Gigabit Ethernet Controller Atheros Communications Inc. AR928X Wireless Network Adapter Operating System Linux Backtrack 5 R3 |
| 2 | Software | Apache2, php5, Nagios Core 3.5, Nagios Plugin 1.5 |
3.3 Materials
| NO | Materials | Specification |
|---|---|---|
| 1 | 12 PCs | Intel® Pentium® dual-core processor 1GB RAM 128MB VGA 100GB HDD 10 Operating System Windows Tiny XP 2 Operating System Linux Ubuntu 12.04 lts |
| 2 | Cisco Switch | 16 port |
| 3 | https://elearning.unud.ac.id | Linux Server |
| 4 | Laptop ACER | Just like in the tools section. |
3.4 Setup
3.4.1 Nagios Installation
The Nagios installation can be found at http://nagios.sourceforge.net/docs/3_0/quickstart-ubuntu.html
3.4.2 Nagios Configuration
An example of a Nagios configuration can be found at http://nagios.sourceforge.net/docs/3_0/monitoring-routers.html.
3.4.3 MRTG Intallation
MRTG installation can be seen at https://help.ubuntu.com/community/MRTG.
3.4.4 Setting Up Network Connection
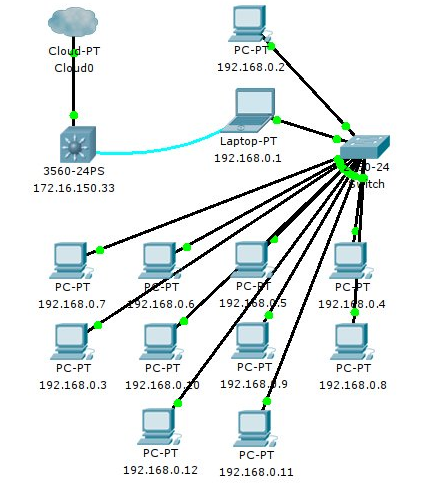
Nagios server is a laptop with IP 192.168.0.1. IP 192.168.0.2 and 192.168.0.3 are PCs with Ubuntu lts 12.04 operating system. The other PC is the Windows Tiny XP operating system. For all PCs have a default gateway of 192.168.0.1. The laptop will forward to 172.16.150.33. The laptop uses IP forward and iptables to forward to 172.16.150.33.
Chapter 4 Discussion
4.1 Nagios Display on browser
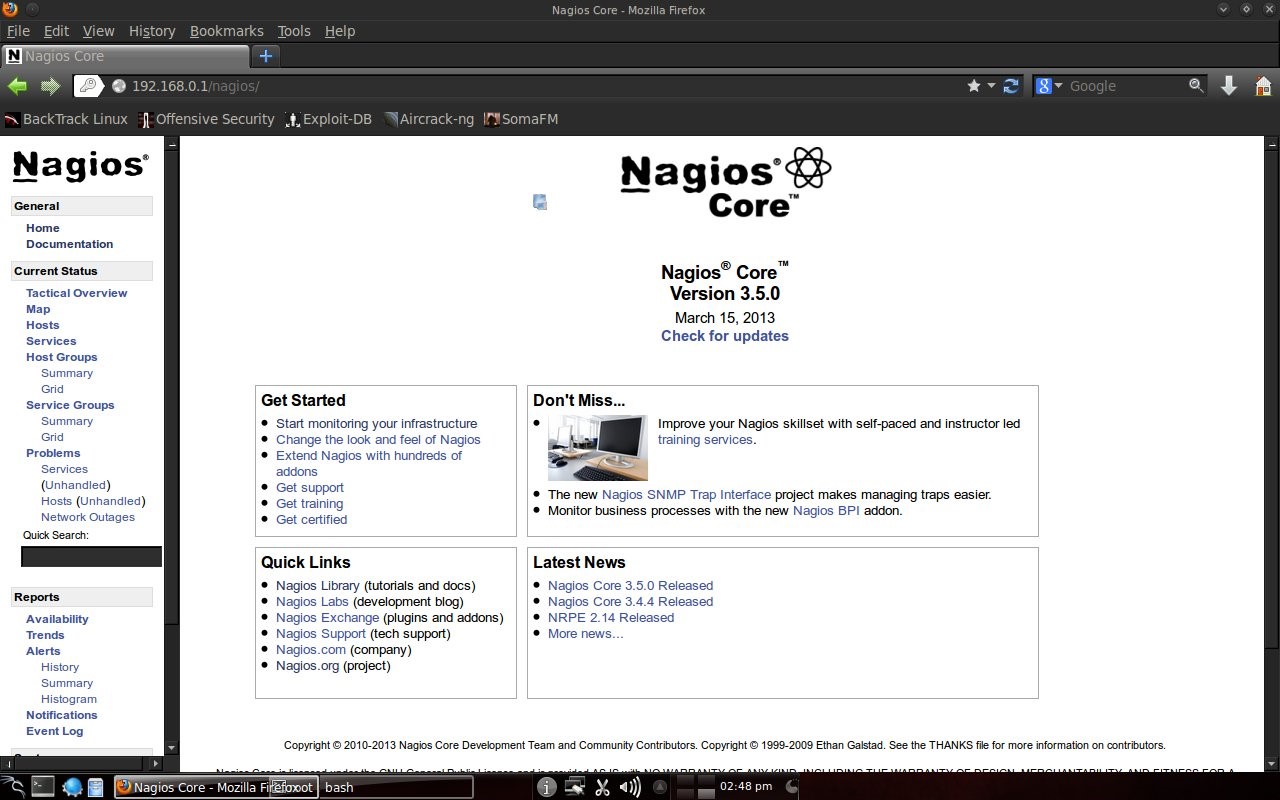
On the local network, Nagios can be accessed at the address http://192.168.0.1/nagios with the username Nagiosadmin and the password for Nagios. If you have a public IP and domain name, Nagios can be accessed with a domain address.
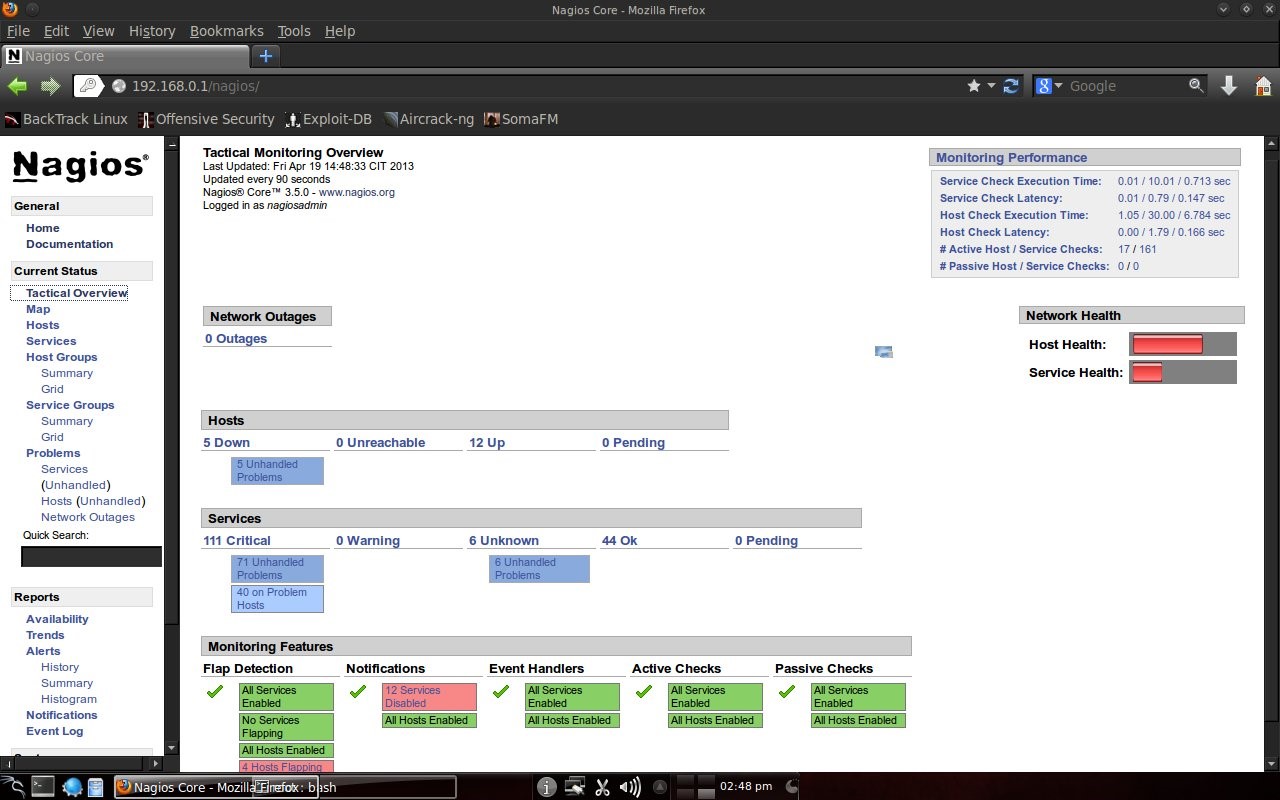
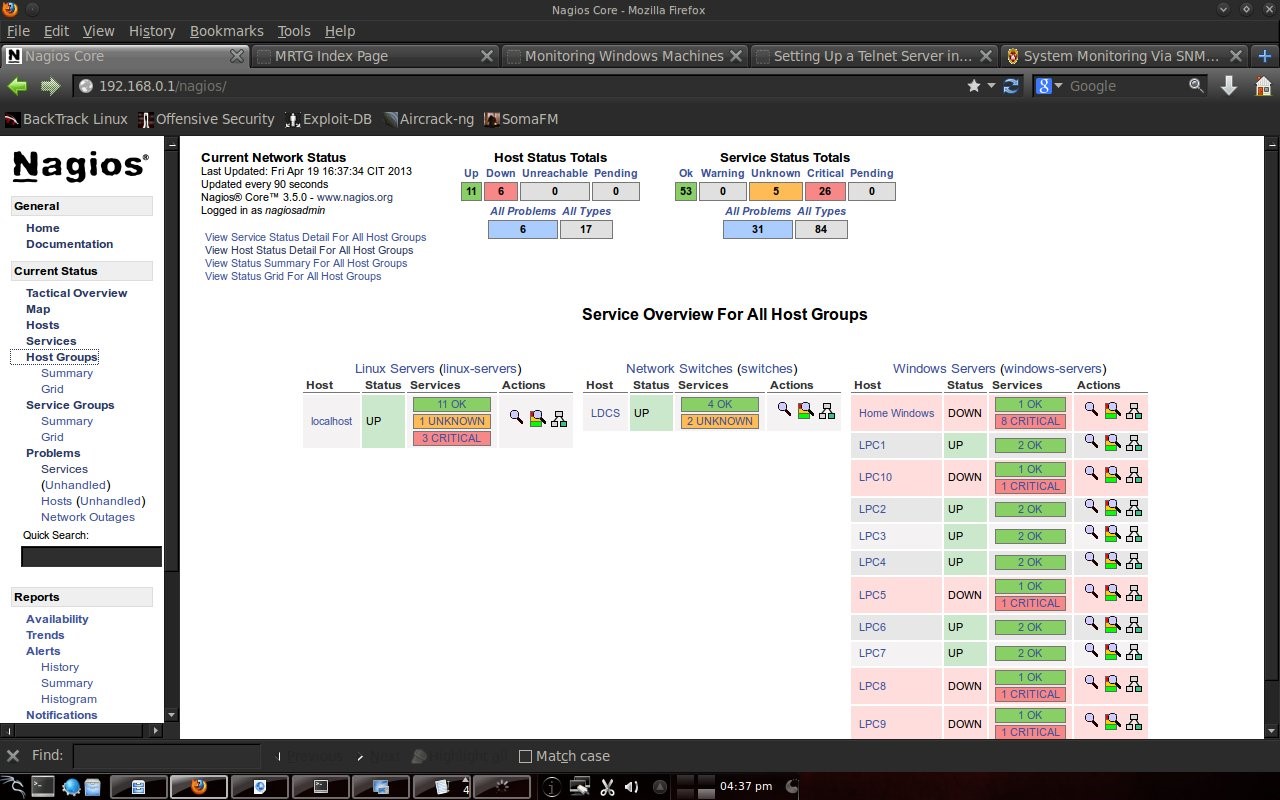
4.2 Host state display
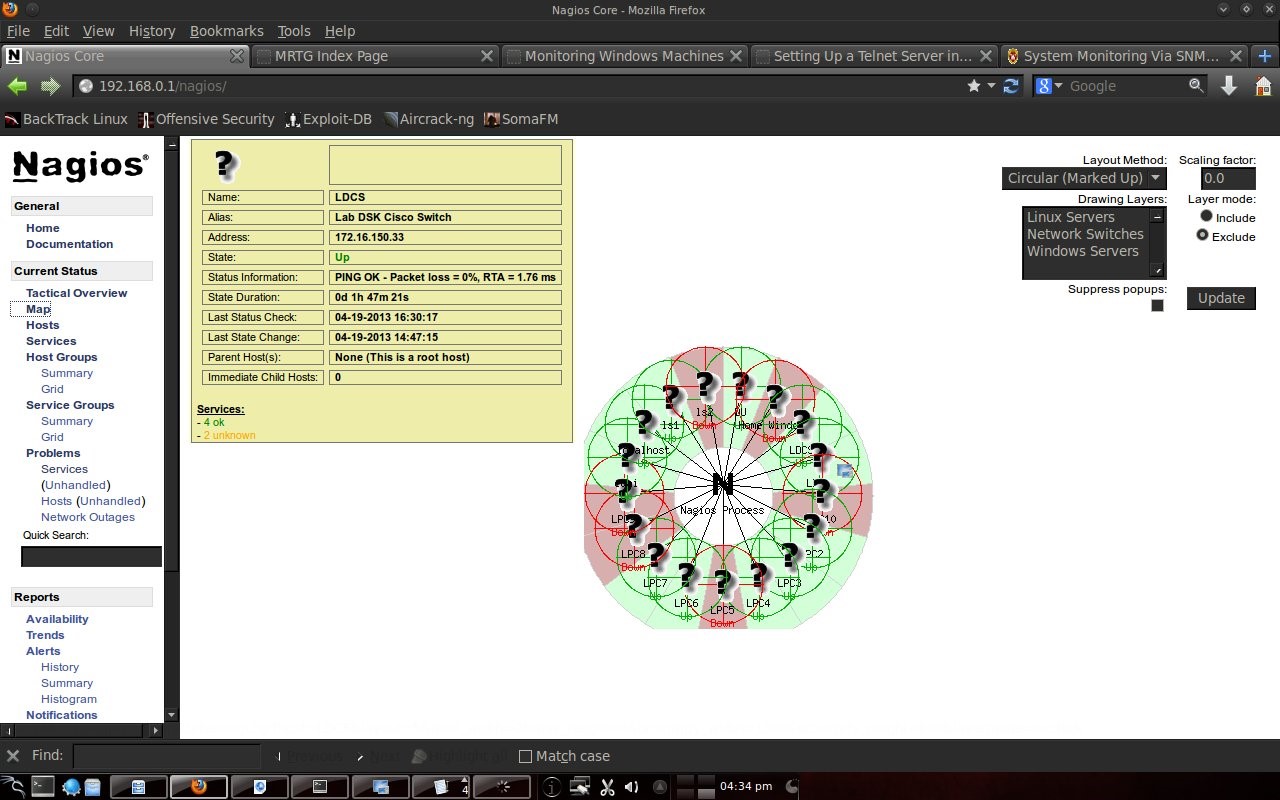
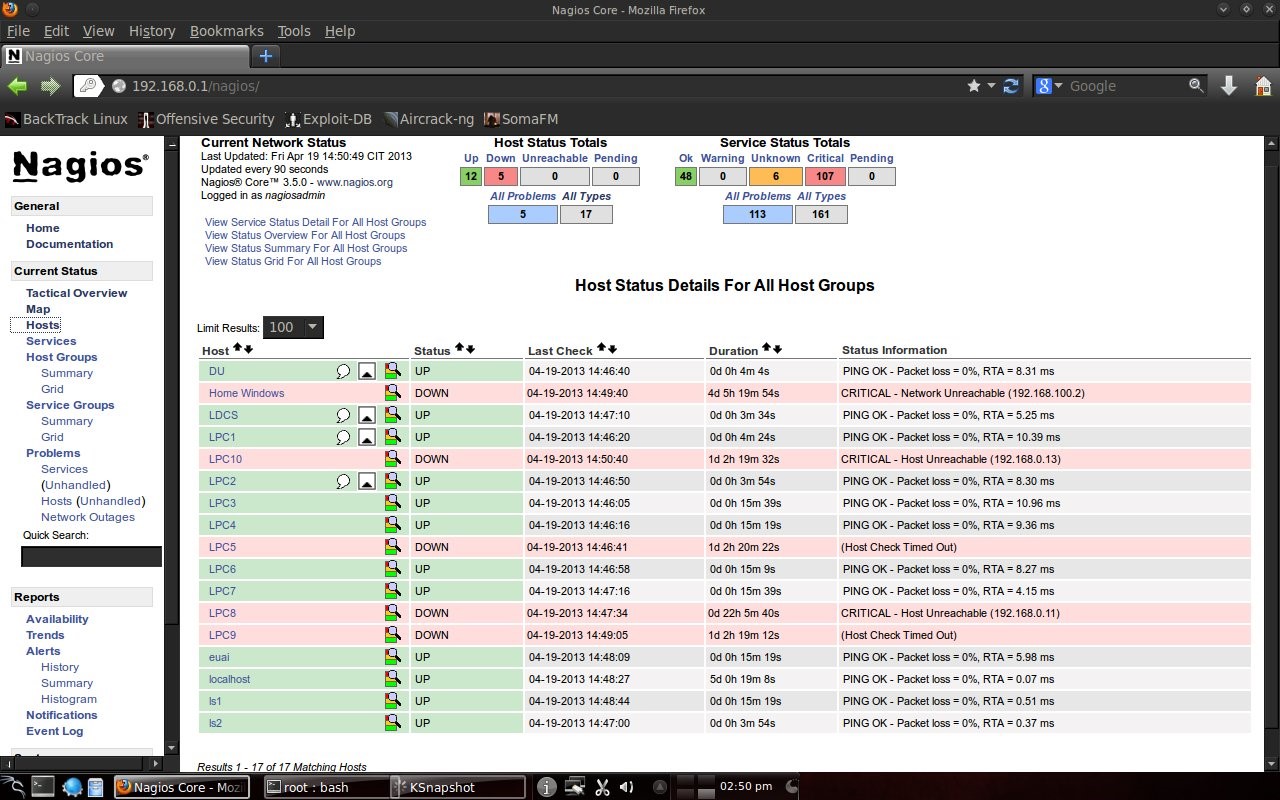
Here you can see that Home Windows is in a dead state because it is a computer in the author's house and is not connected to the computer lab. PC5, PC8, PC9 and PC10 labkom networks are off. After checking the physical condition, it turned out that there was a problem with the network cable. After the cable is replaced, the PC network is alive. The other hosts are normal. DU is DNS UNUD with IP 172.16.0.6, LDCS is Cisco Switch DSK Lab with IP 172.16.150.33, euai is elearning.unud.ac.id, ls is labkom server with Ubuntu linux operating system, and LPC is labkom PC with operating system Windows Tiny XP.
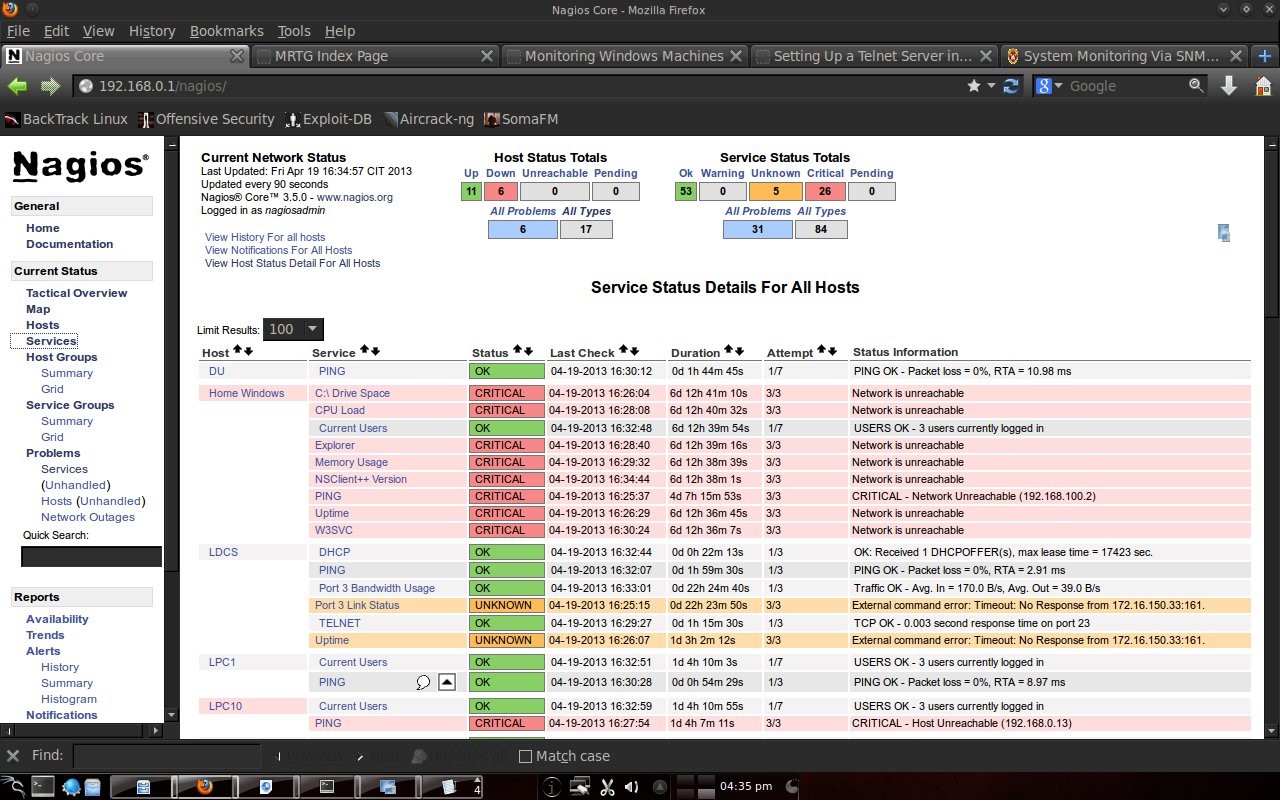
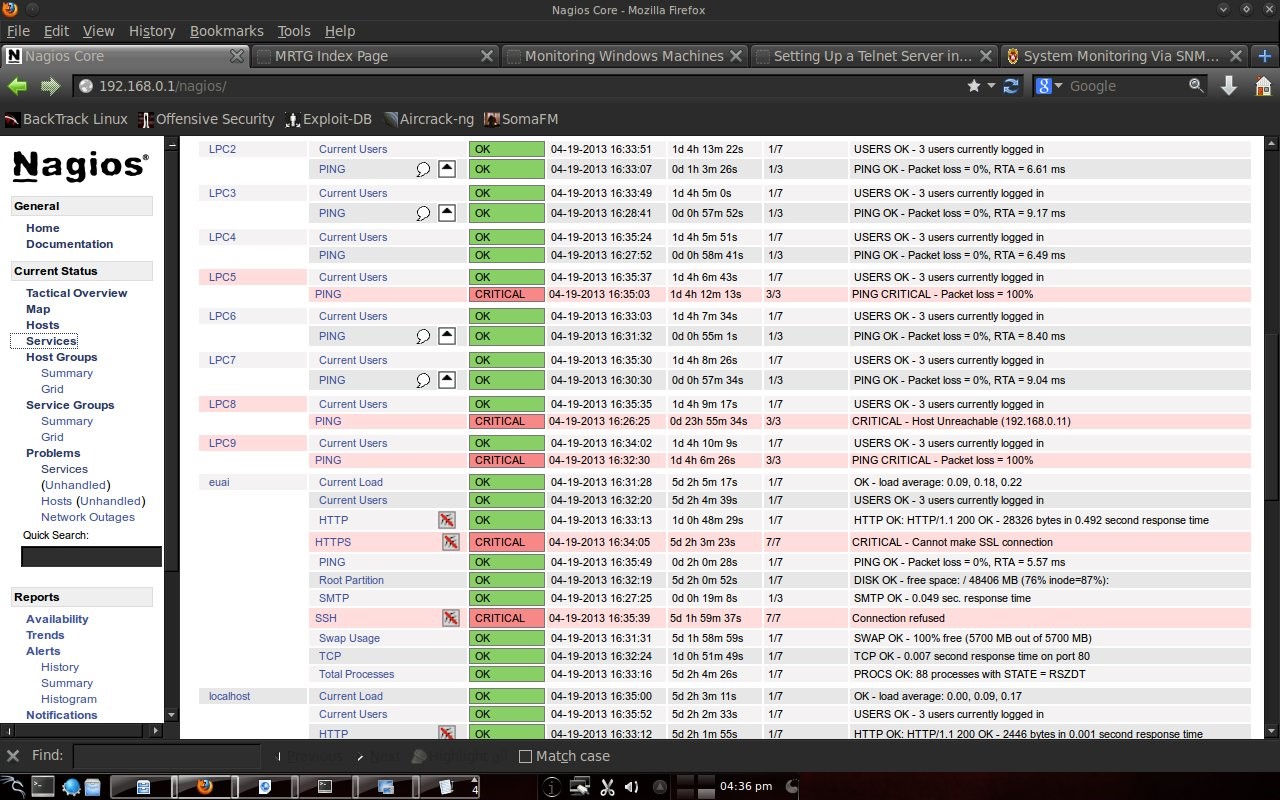
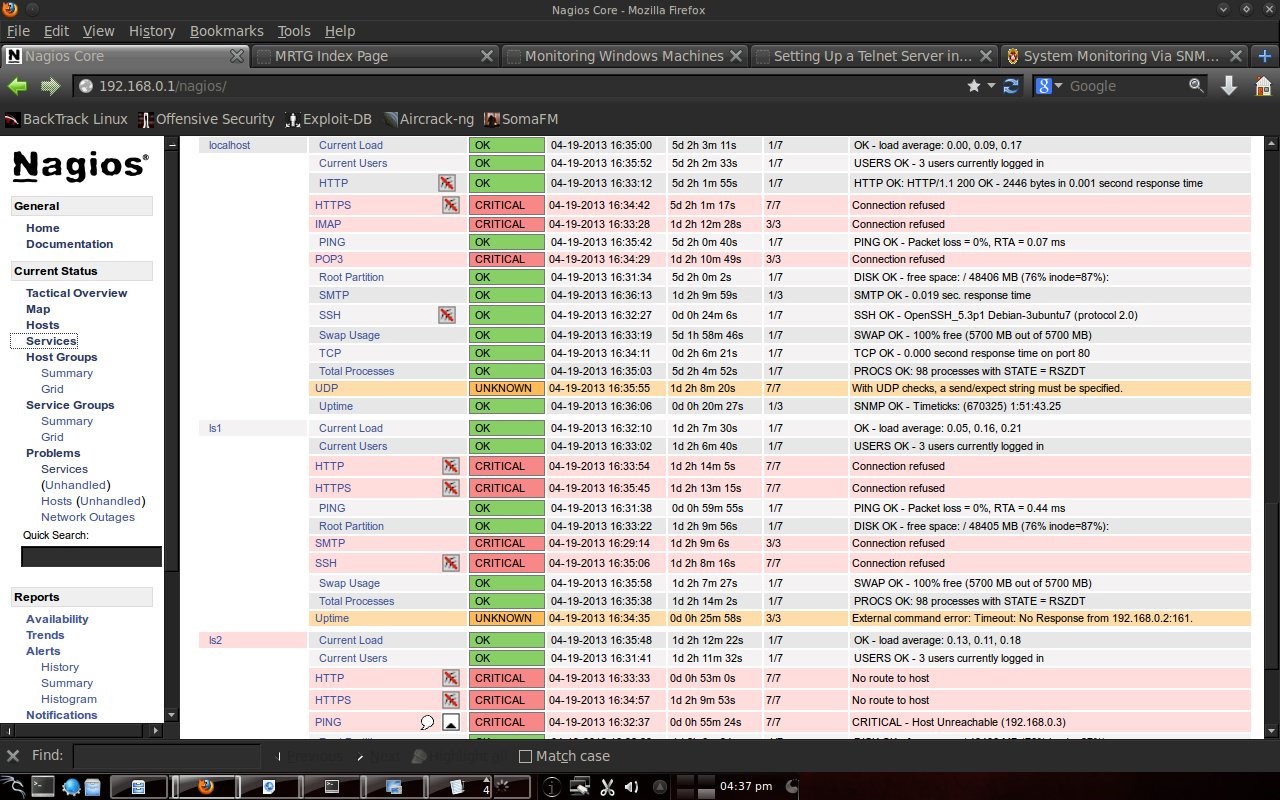
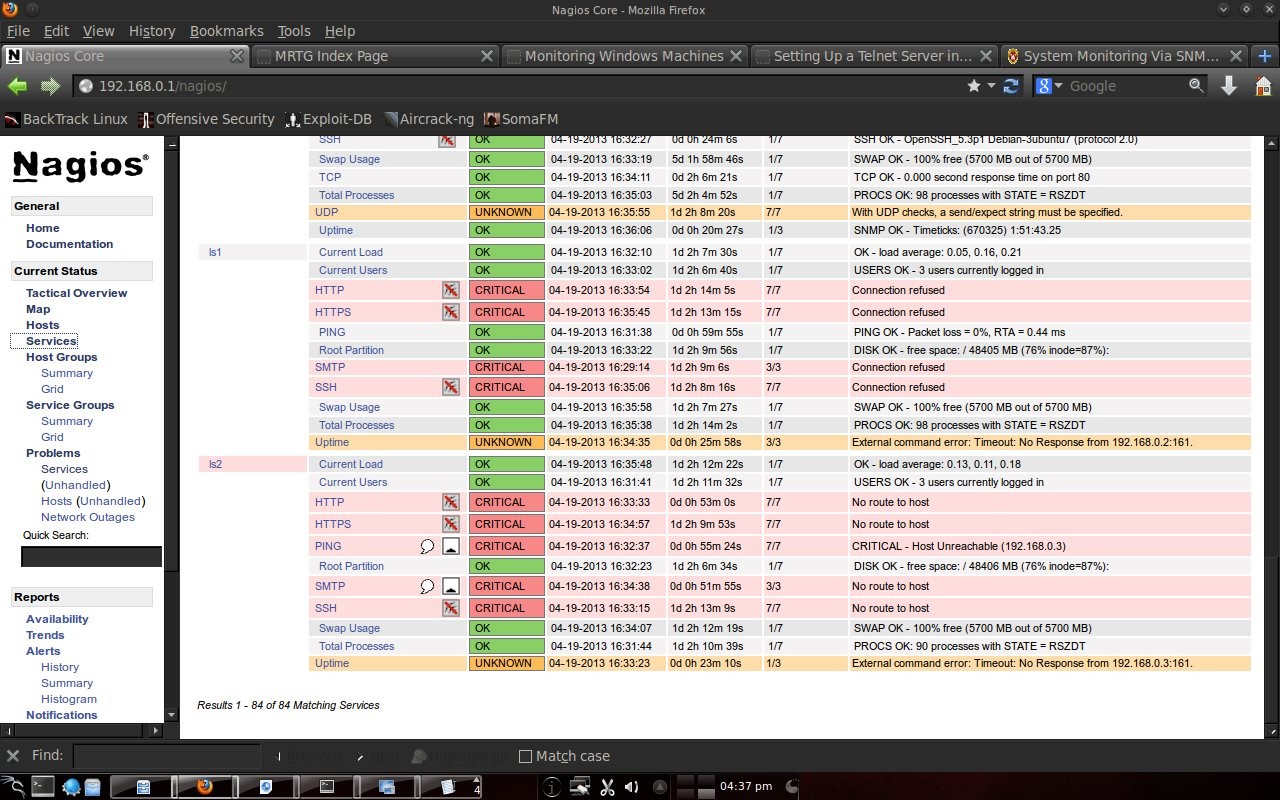
4.3 Service Display
Nagios can also monitor services on hosts such as http, smtp, ftp, dhcp, dns, mrtgtraf, partitions and others. Conditions are OK, warning, critical set by the user, for example ping, set a warning if the RTA (Round Trip Average) is above 200 ms and critical if it is above 300 ms.
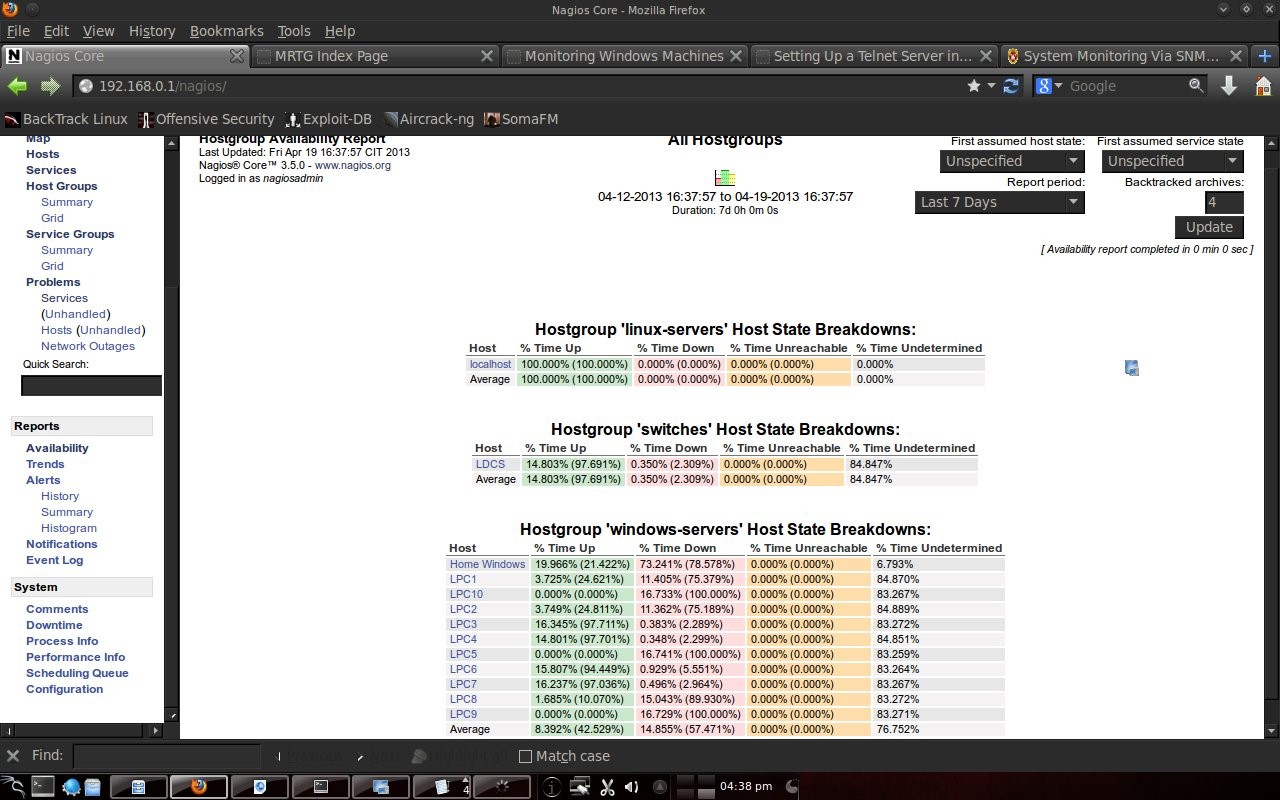
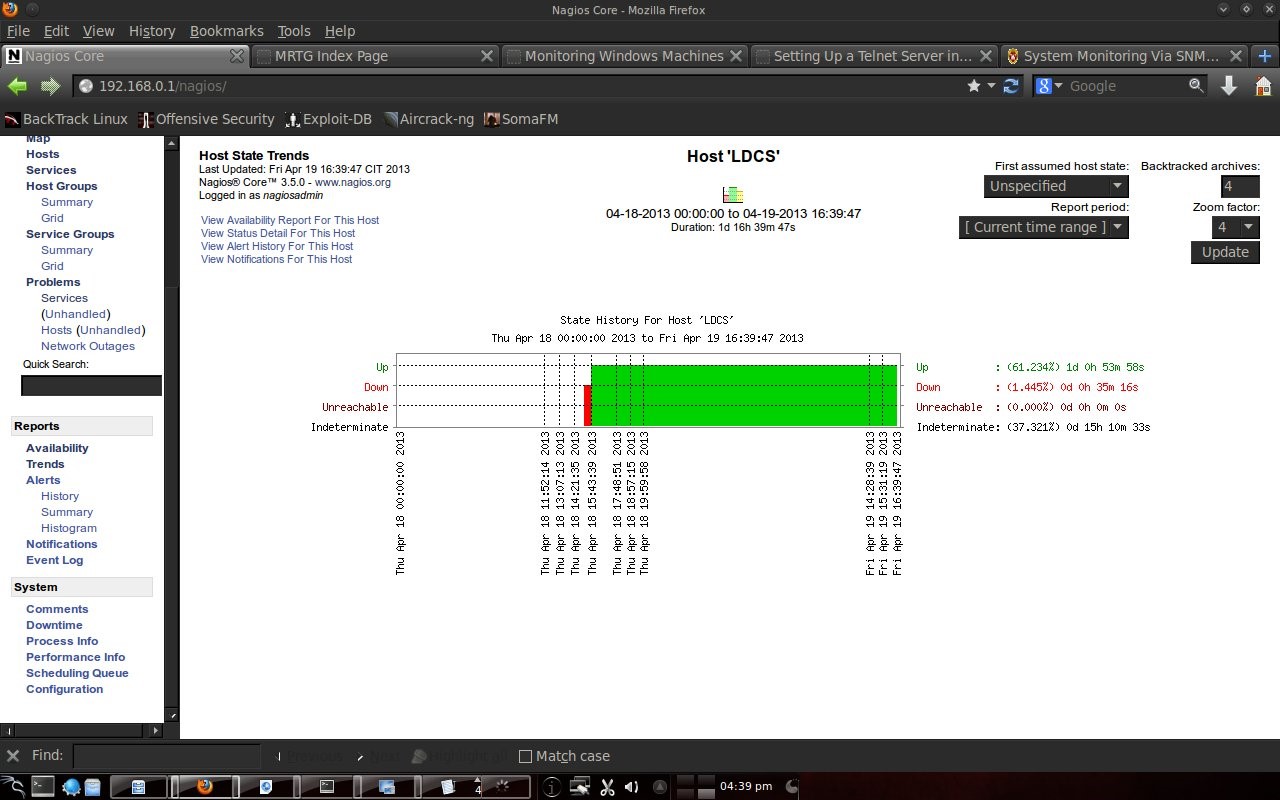
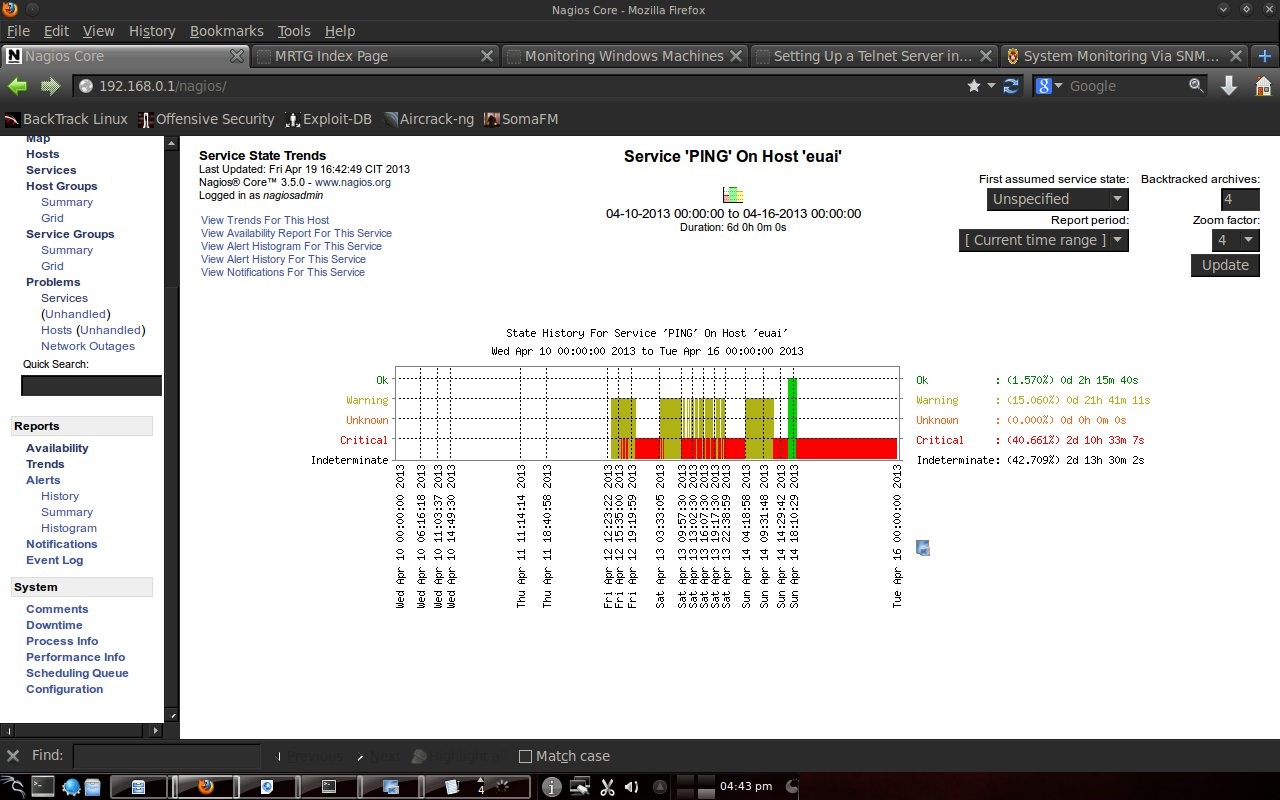
4.4 Report on Nagios
Nagios is also capable of making reports. What is reported is the host state from the first monitoring to the last condition. So the monitoring results were recorded by Nagios.
Chapter 5 Closing
5.1 Conclusion
In the computer lab, Electrical Engineering, Udayana University is very suitable for installing Nagios (monitoring servers). With many PCs that are alive and used every day for almost 24 hours, Nagios can monitor the condition of the PC. Network to the Internet in the computer lab using the facilities of Udayana University. By being given a default gateway in the DSK lab and DNS UNUD, Nagios can monitor this. In trouble conditions, instead of checking devices 1 by 1 it is more efficient to see the state of the host with Nagios, because Nagios can display which ones are in good condition and which are in bad condition.
Bibliography
- Nagios, 2013. http://www.nagios.org/about diakses 21 April 2013.
- Mitchel, B. 2013. http://compnetworking.about.com/od/network_ping/g/what-is-a-ping.htm diakses 21 April 2013.
- Nagios, .2013. http://nagios.sourceforge.net/docs/3_0/toc.html diakses 5 April 2013.
- Nagios, .2013. http://nagios.sourceforge.net/docs/3_0/quickstart-ubuntu.html diakses 10 Maret 2013.
- Nagios, .2013. http://nagios.sourceforge.net/docs/3_0/monitoring-routers.html 10 Maret 2013.
Mirror
- https://www.publish0x.com/fajar-purnama-academics/the-use-of-nagios-in-the-electrical-engineering-computer-lab-xnlrmyn?a=4oeEw0Yb0B&tid=blogger
- https://0fajarpurnama0.github.io/bachelor/2020/11/12/nagios-electrical-engineering-computer-lab-udayana-university
- https://0fajarpurnama0.medium.com/the-use-of-nagios-in-the-electrical-engineering-computer-lab-of-udayana-university-ea83a05d8228
- https://hicc.cs.kumamoto-u.ac.jp/~fajar/bachelor/nagios-electrical-engineering-computer-lab-udayana-university
- https://blurt.world/blurtech/@fajar.purnama/the-use-of-nagios-in-the-electrical-engineering-computer-lab-of-udayana-university?r=fajar.purnama
- https://0darkking0.blogspot.com/2020/11/the-use-of-nagios-in-electrical.html
- https://hive.blog/technology/@fajar.purnama/the-use-of-nagios-in-the-electrical-engineering-computer-lab-of-udayana-university?r=fajar.purnama
- https://0fajarpurnama0.cloudaccess.host/index.php/9-fajar-purnama-academics/101-the-use-of-nagios-in-the-electrical-engineering-computer-lab-of-udayana-university
- https://steemit.com/computers/@fajar.purnama/the-use-of-nagios-in-the-electrical-engineering-computer-lab-of-udayana-university?r=fajar.purnama
- http://0fajarpurnama0.weebly.com/blog/the-use-of-nagios-in-the-electrical-engineering-computer-lab-of-udayana-university
- https://0fajarpurnama0.wixsite.com/0fajarpurnama0/post/the-use-of-nagios-in-the-electrical-engineering-computer-lab-of-udayana-university
- https://read.cash/@FajarPurnama/the-use-of-nagios-in-the-electrical-engineering-computer-lab-of-udayana-university-13e9ae38
- https://www.uptrennd.com/post-detail/the-use-of-nagios-in-the-electrical-engineering-computer-lab-of-udayana-university~ODA5MDEy
Comments
Post a Comment